Elution Profile
Affinity chromatography using Matrex Red A Gel allowed us to successfully purify Drosophilamelanogaster IDH 340-fold (Table 1).
|
|
|
|
|
|
|
|
|
|
|
|
|
|
|
|
|
|
|
|
After pumping the 45-65% pellet preparation over
the column and washing the column, two peaks of IDH activity were identified
(Figure 5). The first peak is the result of the total amount of IDH greatly
exceeding the columnís capacity to bind the enzyme. The second peak represents
the elution of the bound enzyme with the NADP+ / isocitrate
gradient wash. The three fractions in this second peak containing maximal
IDH activity were pooled, concentrated and used to determine the parameters
of IDH. Those fractions containing IDH that did not bind (the first peak)
were pooled, and after the column had been recharged, pumped back onto
the column in order to ensure that two forms of IDH, one capable of binding
to the matrex and one not, did not exist in our preparation. Additional
samples of purified IDH were recovered by repeating the gradient wash.
Substrate Kinetics
The Km for isocitrate was estimated
to be 29.8 ± 7.9 µM, while the Km for coenzyme
was estimated to be 1.05 ± 0.1 µM (Table 2). These Km
values for isocitrate and NADP+ are consistent with previous
values for Drosophila melanogaster determined by Williamson, et
al., (1980).
|
|
|
|
|
|
|
|
|
|
|
|
*N = number of determinations
Divalent Metal Ions
Our data confirm that Drosophila IDH requires
the presence of divalent metal ions for proper catalytic function (Table
3). When no additional metals were added to the assay, a low level of activity
was observed due to contaminating metal ions in the buffer ingredients.
The addition of EDTA (2 mM) to the reaction mixture reduced this activity
to zero. When magnesium (2 mM) was added to the basic reaction mixture,
activity was enhanced 3.5-fold. When manganese (2 mM) was added to the
basic reaction mixture, activity was enhanced 5.2-fold.
|
|
|
|
|
|
|
|
|
|
|
|
|
|
|
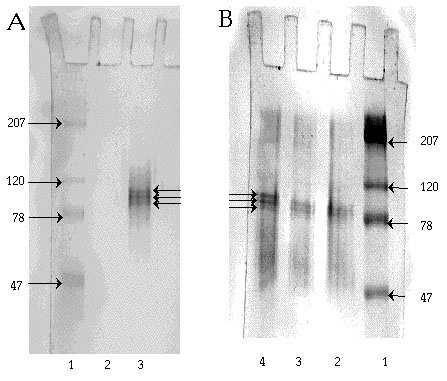
Polyacrylamide Gel Electrophoresis
Three bands of NADP+-dependent isocitrate
dehydrogenase activity were observed after staining a native gel for IDH
activity (Figure 6A). The molecular sizes of these three bands were estimated
to be 103, 97, and 90 kDa. Similarly, three protein bands, corresponding
to the three bands of IDH activity, were observed in that half of the gel
stained with Coomassie Blue (Figure 6B). In addition, two minor protein
bands with approximate molecular weights of 200 kDa and 150 kDa were detected
in the Coomassie staining process. In a second trial, the three forms of
IDH were determined to have molecular weights of 109, 100, and 94 kDa.
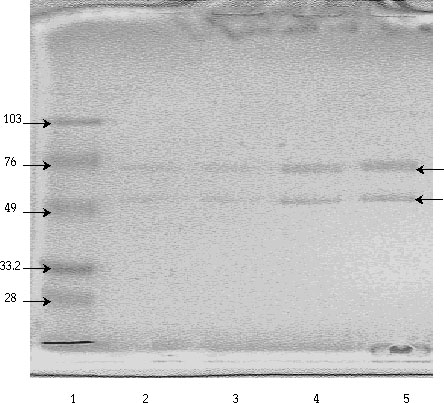
SDS-PAGE indicated that IDH is a heterodimer. On a 7.5% gel, two subunits of different sizes were observed, one estimated to be 65 and the other 51 kDa. On a 10% gel, the subunits were determined to have molecular sizes of 70 and 57 kDa (Figure 7). No other protein bands were detected on either of these SDS gels. The above values are slightly larger than, but consistent with, those reported by Williamson, et al., (60 kDa and 50 kDa, 1980).