Materials and Methods
I. Cloning
DNA Manipulations
Preparations of lambda phage strains 9-1J and 10-1 B provided by Stephanie Moses were digested with Sal I, Bam HI, Hind III , Sal I+Hind III, Sal I+Bam HI, and Xho I (Sambrook et al., 1989). The 9-1J (860µg/µl) strain was digested with Sal I and the 10-1B (3280µg/ml) strain was digested with Bam HI for use in ligation and transformation experiments. DNA was gel purified by electroelution in a V apparatus (Medical Specialties) and was cleaned via an ethanol precipitation procedure (Sambrook et al., 1989).
Plasmid pSK- was digested with Sal I. After thirty minutes at 37C, the digested pSK was cleaned and resuspended in distilled water. The pSK was treated with calf intestinal alkaline phosphatase (CIAP, Promega) to prevent self ligation. All DNA quantities were determined by measuring absorbance of light at 260nm. Mini prep DNA was also analyzed by restriction enzyme digestions.
Ligation and Transformation
Ligation reactions were set up using 4 µl aliquots of cleaned DNA inserts. In each ligation, approximately 50pg of CIAP treated pSK was used in a 10 µl total. Reactions were incubated at 16C for thirty minutes according to the manufacturer's protocol.
50 microliters of Top 10 F´ One Shot cells and 1 µl of the ligation reactions were used in each transformation (protocol provided by Novagen). The transformed cells were spread out onto LB Ampicillin (100µg/ml), IPTG (40µl of 100mM), X-gal (32µl of 50mg/ml) plates (@ 200 µl/plate) and incubated at 37C overnight.
Mini Prep
White colonies were isolated from plates using sterile toothpicks and suspended in 2 ml of LB Ampicillin (100µg/ml). The colonies were allowed to grow overnight at 37C and 400 rpm. The plasmid DNA was isolated from the cells using an alkaline lysis procedure (Sambrook et al., 1989). The mini prep DNA was resuspended in 50 µl of TE and 5 µl of RNase A.
II. Biochemical cell mating disruption
Chloroquine treatment
NO- and cc125 cells were suspended in 400µl solutions of Nitrogen Free High Salt medium (NFHSM) and varying chloroquine concentrations (100mM, 10mM, 5mM, 1mM, or 0.5mM). All strains of cells (GA1, R3+, NO-, cc124, and cc125) were suspended in NFHSM only. Chloroquine-treated gametic cells were combined with non-chloroquine treated gametic cells and flagellar agglutination was assessed after different time intervals. Zygote formation was tested by mixing cells of the opposite mating type (chloroquine treated vs. non chloroquine treated) over night . The formation of a green pellicle indicated that zygotes had been formed.
All strains of cells (NO-, R3+, cc124, cc125, GA1, and ISO-; obtained from Duke University) were grown on 0.1mM and 0.01mM chloroquine and TAP (Tris Acetate Phosphate) plates. Cells from each plate were suspended in 400µl of NFHSM plus the appropriate concentration of chloroquine and kept under constant illumination until gametic. The mt- strains were then added to mt+ strains to determine if flagellar agglutination occurred.
Folimycin treatment
R3+, NO-, cc124, and cc125 cells were suspended in NFHSM, NFHSM plus DMSO, and NFHSM plus DMSO plus folimycin solutions. The cells were kept under lights until gametic and then agglutination between the mt+ and mt- strains was examined after different time intervals.Suspended cell numbers were quantified with a hemacytometer before mating.
III. Tetrad Analysis
Wild type cc125 cells and GA1
cells were suspended in NFHSM in Erlenmeyer flasks under constant
light and at ambient temperature (Harris, 1989). Once the cells
had become gametic, the two cell types were allowed to mate using
the protocol outlined by Harris (1989). Zygote progeny were removed
from a 1.5% bactoagar TAP plates and spread evenly onto TAP plus
arginine plates. The plates were left overnight under constant
illumination. Cells were resuspended in 400µl of NFHSM and
put under constant light until gametic. To determine the mating
types of the progeny, the cells were added separately to 10 µl
of R3+ and NO- cells (selected by Dr. Goodenough for high efficiency
mating).
I. Cloning
A. Sample assessment
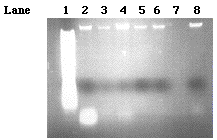
Before the putative GA1 gene could be cloned, the six samples of lambda DNA provided by Stephanie Moses had to be analyzed in order to determine which sample had the most DNA with the least amount of RNA contamination. Stephanie had mass produced three different stocks of the 9-1 J genomic DNA (860, 540, and 560µg/µl) and 10-1 B genomic DNA (1220, 1840, 3280 µg/µl). Ten microliters of each stock sample was loaded onto a 0.77% agarose gel (Figure 6). The brightest and thickest bands in lanes 4 and 8 indicate that the 860µg/µl 9-1 J DNA and 1220µg/µl 10-1 B DNA samples contain the most DNA and thus would most likely yield the best results when trying to isolate specific fragments of the DNA for cloning. The 10-1 B genomic strains (lanes 2-4) appeared to have the most RNA contamination which can be determined by the presence of the white bands at the bottom of the gel. The smeared bands in lane 1 reveal that too much of the 1 kb molecular weight ladder was loaded in the well.
Figure 6. A 0.7% agarose gel. Ten microliters of 1 kb ladder was loaded into lane one. Ten microliters of 3280, 1840, 1220 µg/µl concentrations of 10-1 B genomic DNA were loaded into lanes 2, 3, and 4 respectively. Ten microliters of the 560, 540, and 860 µg/µl concentrations of 9-1 J genomic DNA were loaded into lanes 5, 6, and 8 respectively.
After determining which samples we were going to use, we needed to determine which specific fragments of the DNA we were going to target for cloning. In order to do this, we had to cut the DNA with various restriction enzymes to verify the restriction enzyme map that was provided by E. Michelle Long, a research student of Dr. Armbrust. (Figure 3; Figures 7 A and B).
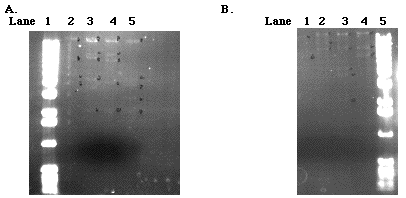
Figure 7. Left Gel. A 0.7% agarose gel loaded with 9-1 J (560µg/µl) digestions. Five microliters of 1 kb ladder was loaded in lane 1. Digestions of 9-1 J with restriction enzymes Hind III, Sal I, Sal Iand Bam HI, and Sal I and Hind III were loaded into lanes 2, 3, 4, and 5 respectively. Right Gel. A 0.55% agarose gel loaded with 9-1 J(560µg/ml) and 10-1B( 1840µg/ml) DNA digestions. Five microliters of a 1kb ladder was loaded in lane 5. 9-1 J DNA digested with Bam HI was loaded into lane 1(@20µl). 10-1 B DNA digested with Xho, Sal I, and Bam HI were loaded into lanes 2, 3, and 4, respectively (@20µl each).
|
Restriction Enzymes |
Hind III | Sal I | Sal I and Bam HI | Sal I and Hind III |
Bam HI |
| Number of fragments | >10 | 5 | 5 | 5 | 2 |
| Size of fragments (kilobase, kb) | corresponds to MW ladder | 12, 9, 8, 4, 2 | 12, 9, 6.5, 3.5, 2 | 12, 4, 3, 2.5, 2 | 12, 7 |
| Fragment totals (kb) | corresponds to MW ladder | 35 | 33 | 23.5 | 19 |
Table 1. Results from the 9-1 J (560µg/µl) DNA digestions with various enzymes.
| Restriction Enzymes | Xho | Sal I | Bam HI |
| Number of fragments | 3 | 4 | 3 |
| Size of fragments (kilobase, kb) | 12, 10, 9 | 12, 8, 4, 3 | 12, 9, 7 |
| Fragment totals (kb) | 31 | 27 | 29 |
Table 2. Results from the 10-1 B(1840µg/ml) DNA digestions with various restriction enzymes.
C. Insert isolation
Therefore, the next step was to digest a 30µl aliquot of the 9-1J with Sal I in a 50µl total. Five fragments separated from the gel as was predicted by the restriction map and the data from previous digestions (Figure 8). The 12 kb and 9kb fragments were assumed to be the arms of thelambda strain. The other three fragments (the 8/9 kb, 4kb and 2 kb fragments) were extracted from the gel and then purified.
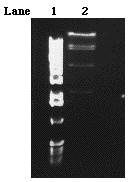
Figure 8. A 0.55% gel of 9-1J
(860µg/ml) DNA digested with Sal I. Five microliters of
a 1kb ladder was loaded into lane one. The 50µl Sal I digestion
was loaded into the double wide lane 2.
The purified DNA inserts were ligated into pSK- and transformed into Top 10 F' cells and spread onto LB ampicillin IPTG X-gal plates. Two white colonies grew on one of the 8/9 kb plates indicating that two cells had been successfully transformed by the plasmid. The DNA insert in the plasmid disrupts the production of ß-galactosidase which normally cleaves X-gal forming an insoluble blue product. Thus, cells transformed by plasmids with inserts yield white colonies that are easily distinguished from the non-transformed blue colonies on the agar. Cells from the two colonies were picked from the plate and grown overnight in 2 ml of LB ampicillin which allowed for multiple copies of the DNA insert to be harvested. Only one of the colonies that was picked successfully grew overnight. Using an alkaline lysis protocol, the DNA was collected from the cells. In order to determine if the mini prep DNA contained a fragment of interest, the mini prep DNA was digested with Sal I and without Sal I (control). The size of pSK is known to be approximately 2.9 kb (Figure 11). The digestion of the mini prep DNA should reveal a band of this size and a second band, the size of its insert. In fact, the Sal I digestion did reveal a band thatwas approximately 3.2 kb and a second band that was approximately 8/9 kb (Figure 9) . In contrast, the lane (3) loaded with just mini prep DNA revealed a single fragment of about 12/13kb. Although these results seemed to indicate that we had cloned the largest Sal I fragment, verification of our results was still necessary.
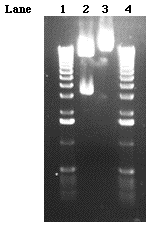
Figure 9. A 0.55% gel loaded with 8/9 MP DNA digested with and without the Sal I restriction enzyme. Five microliters of 1 kb ladder was loaded in lanes 1 and 4. The Sal I/mini prep DNA digestion was loaded in lane 2 and the no Sal I/mini prep DNA digestion was loaded in lane 3.
To verify that the insert was indeed the large 8/9 kb Sal I fragment, we had to digest the mini prep DNA with several other restriction enzymes and confirm the results with the restriction enzyme map (Figure 3). The following table shows the results obtained from the various digestions
| Restriction Enzymes | Sal I and Hind III | Sal I and Not I | Sal I and Xho | Sal I and Bam HI | Bam HI |
| Number of Fragments | 10 | 3 | 4 | 3 | 2 |
| Size of Fragments (kb) | 2.5, 3.1, 7 | 3, 3, 3, 2.5 | 8.5, 3.1, 0.5 | 0.5, 13-14 | |
| Sum of Fragments | 12.6 | 11.5 | 12.1 | 13.5 |
Table 3. Mini prep DNA digestions with various restriction enzymes.
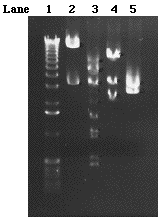
Figure 10. A 0.55% gel loaded
with 8/9kb mini prep DNA digestions. Five microliters of 1 kb
ladder was loaded in lane 1. Mini prep DNA digested with Sal
I, Sal I and Hind III, Sal I and Not I, and Sal I and Xho were
loaded in lanes 2, 3,4, and 5, respectively.
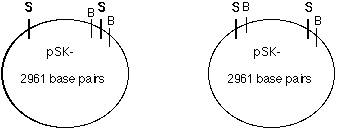
Figure 11. Orientation of the 8/9 kb Sal I fragment in pSK-. Depending on the Sal I 8/9 kb insert's orientation in pSK-, when the plasmid was cut with Bam HI the left orientation would produce a large band (@13kb) and a smaller band (@0.5-1 kb); the right orientation would produce two larger bands (@7-8kb). The fragment inserted in pSK- like it is shown in orientation A (Figure 12 B).
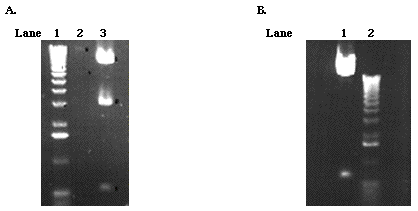
Figure 12. Left gel. A 0.55% gel loaded with mini prep DNA digestions. The molecular weight ladder was loaded in lane 1. The mini prep DNA digested with Sal I and Bam HI was loaded in lane 3. Right Gel. A 0.55% gel loaded with mini prep DNA digested with Bam HI (Lane 1). Molecular weight marker was loaded in lane 2.
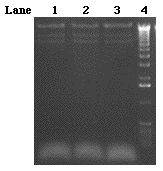
Figure 13. A 0.55% gel loaded with 10-1 B(3280µg/ml) DNA digested with Bam HI. Three separate 50µl digestions were loaded into double wide lanes 1, 2, and 3. The molecular weight marker was loaded into lane 4.
A. Chloroquine Treatment
The sequence data of the cDNA that Dr. Armbrust had obtained from wild type GA1 cDNA was translated into an amino acid sequence and sent via email to Genbank at the National Institutes of Health where the sequence was compared to all amino acid sequences that are stored in the data bank. The top hits indicated that our sequence was very similar to a gene encoding an H+-ATPase (Table 4). Having this information, a model was proposed as the mechanism causing the mating disruption in GA1 cells (Figure 14). In addition, the accession numbers of the top ten hits weresent via email to the "retrieve server" at Genbank which provided the amino acid sequences and sources of the genes. Using the MACDNAsis program, the amino acid sequences were multiplyaligned with the amino acid sequence of the GA1 cDNA. There was a 31% sequence similarity between the GA1 sequence and the Leishmania donovania sequences and an 18% sequence similarity to the Heterosigma akashiwo sequence (Appendix A). Leishmania donovania and Heterosigma akashiwo are both unicellular, flagellated organisms .
| Accession Number | Source | Protein |
| sp| P11718 | Leishmania donovani | Probable E1-E2 Type CATION ATPase |
| pir||A27124 | Leishmania donovani | H+-transporting ATPase |
| sp|P12522 | Leishmania donovani | Probable E1-E2 Type CATION ATPase |
| gi|2213886 | ND | proton motive ATPase |
| pir||S53302 | Heterosigma akashiwo | H+-transporting ATPase |
| pir||S53301 | Heterosigma akashiwo | H+-transporting ATPase |
| sp|Q08435 | Nicotina pumbaginifolia | Plasma Membrane ATPase |
| sp|P20649 | Arabidopsis thaliana | Plasma Membrane ATPase |
| gn1|PID|d1007201 | ND | plasma membrane H+-ATPase |
| gn1|PID|d1021320 | ND | plasma membrane H+-ATPase |
Table 4. The GA1 amino acid sequence (@300 aa) that has been isolated was sent to Genbank to determine what other proteins have similar sequences. The top ten hits indicate that GA1 protein is an H+-ATPase (ND= not determined).
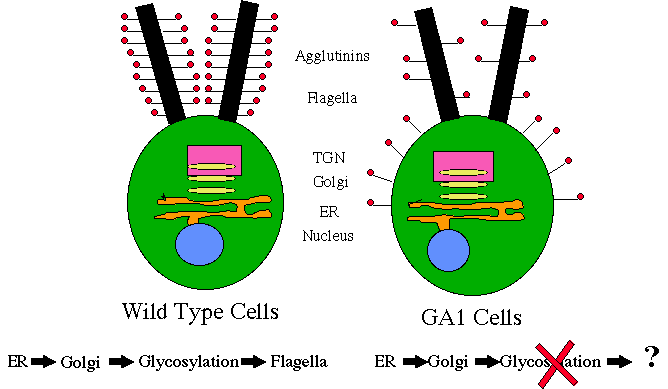
Figure 14. Incomplete glycosylation of the mt- agglutinin model for GA1 cells.
The first chloroquine experiments were performed to determine what concentrations seemed to disrupt the normal mating process. When untreated mt+ and mt- cells are mated, their zygotes will aggregate at the top of the NFHSM solution in a test tube forming a green pellicle. Because GAI cells are mt-, the NO- cells were treated with the NFHSM plus chloroquine solutions. The results showed that the 100, 10 and 5 mM solutions were too concentrated and could not sustain cell viability (Table 4). The positive zygote control ( untreated NO- X R3+) revealed a strong green pellicle. The zygote test revealed that some of the NO- cells in the 100, 10, and 5mM chloroquine/NFHSM solutions were able to survive and mate with the R3+ cells because weak green pellicles formed for each. The pellicles were not as strong as the positive control, however. When the 1.0 and 0.5 mM NO- solutions were mixed with R3+, agglutination was obvious after one hour. However, after 3 hours we observed that cells were agglutinating but taking much longer to shed their cell walls as compared to the positive control (untreated NO- X R3+) (Table 4).
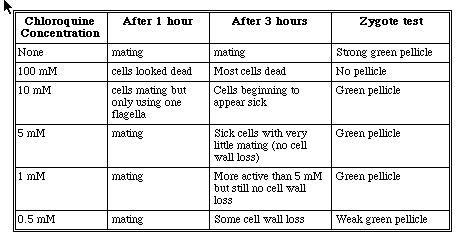
Table 5. Mating observations between NO- and R3+ after NO- was suspended in NFHSM plus varying chloroquine concentrations.
| Chloroquine Concentra tion |
after 6 hours | after 7 hours | zygote test |
| None | lots of mating and cell wall loss | lots of mating and cell wall loss | green pellicle at top but NOT strong |
| 1 mM | some mating and cell wall loss (cell walls lost at a slower rate) | significantly less mating than cc124 X cc125 | green pellicle |
| 0.1 mM | ND | ND | very weak pellicle |
| 0.01 mM | ND | ND | very weak pellicle |
Table 6. Mating observations between cc124 and cc125 after cc124 was suspended in NFHSM with varying chloroquine concentrations. (ND=not determined)
|
cc124 |
NO- |
cc125 |
R3+ |
mating |
zygote test |
|
- |
- |
yes |
green pellicle |
||
|
+ |
+ |
yes |
green pellicle |
||
|
+ |
+ |
no |
green pellicle |
||
|
- |
+ * |
yes |
ND |
||
|
+ |
- |
no |
ND |
||
|
+ |
+ |
no |
ND |
||
|
+ |
+ |
no |
ND |
||
|
+ |
+ |
no |
ND |
Table 7. Mating observations after cells had been grown on chloroquine and tap plates.Cells were made gametic using the same conditions under which they grew with the exception of the controls. A minus sign indicates that there was no chloroquine treatment and a plus sign indicates that there was chloroquine treatment. The concentration of chloroquine remained at 0.01 mM for the entire experiment except for one solution of R3+ cells at 0.1 mM (which is indicated by an asterix.)
B. Folimycin Treatment
Because we were unsuccessful in trying to raise the pH of the intracellular compartments using chloroquine, we decided to us an H+-ATPase inhibitor in normal cells. By using an H+- ATPase inhibitor, the vacuolar pH within the cell would be raised perhaps causing a disruption in the glycosylation process. Therefore, our next experiment involved the use of the H+-ATPase inhibitor, folimycin (Marshanky and Vinay, 1996; Muroi et al. 1993). Folimycin was dissolved in DMSO; therefore, control solutions containing only NFHSM, and DMSO plus NFHSM were made in addition to the experimental solution of NFHSM plus DMSO plus folimycin. The DMSO appeared to have no effect on the cells as they all mated successfully after becoming gametic in the NFHSM and DMSO solution (Table 8). R3+ and NO- cells did not appear to be affected by thefolimycin as the cells continued to mate after 3 and 6 hours. cc124 and cc125 cells, however, did appear to be affected by the drug. After being suspended in the solution under constant illumination for three hours, no cells appeared to agglutinate and there was no cell wall loss. When the gametic cc124 and R3+ cells treated with folimycin were mixed together, aggregates of cells were observed which indicates that there could have been some agglutination; however, after a few seconds the cells dissipated from one another. In both of these experiments, mating/agglutination ability returned after six hours. We believe that the cells are unaffected after a certain time period because folimycin is extremely sensitive to light. Because C. reinhardtii needs light to become gametic, the overexposure probably stopped this drug from working after a certain length of time.
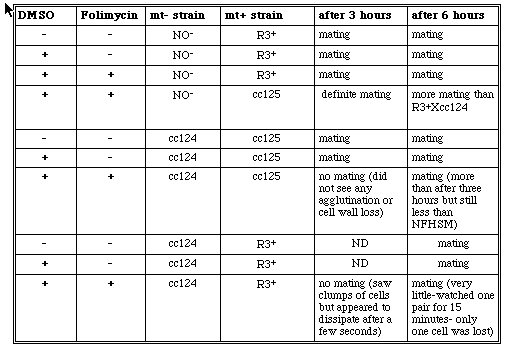
Table 8. Mating observations after cells had been made gametic. All cells were made gametic in NFHSM with either the addition or deletion of DMSO and folimycin . Gametic mt+ cells and mt- cells were mixed after 3 and 6 hours.
Once it had been determined that DMSO did not effect the cells; only NFHSM was used as a positive control solution. To account for folimycin's sensitivity to light, a second folimycin experiment was performed to assess agglutination after only thirty minutes of cell suspension. Thirty minutes, however, was not enough time for cc124 and cc125 cells to become gametic. As a result, mating was observed after 2 and 5 hours (Table 9). When gametic R3+ and NO- folimycin treated cells were mixed, there was significantly less mating and agglutination occurring among the cells as compared to the positive control (non-treated cells). Some agglutination occurred when the gametic cc124 and cc125 folimycin treated cells were mixed but the amount was significantly less when compared to the untreated cc124 and cc125 cells. As observed in the previous experiment, when folimycin treated cc124 was mixed with R3+, there was very little mating. However, when the folimycin treated cc125 cells were mixed with the folimycin t reated NO- cells there was mating and agglutination occurring. Because mating did occur with the folimycin treated NO- and R3+ cells, the folimycin drug appears to have some sort of effect on the cc124 cells only. At this point, additional experiments were necessary to try to determine more accurately if the drug was having a specific effect on the cc124 cells.
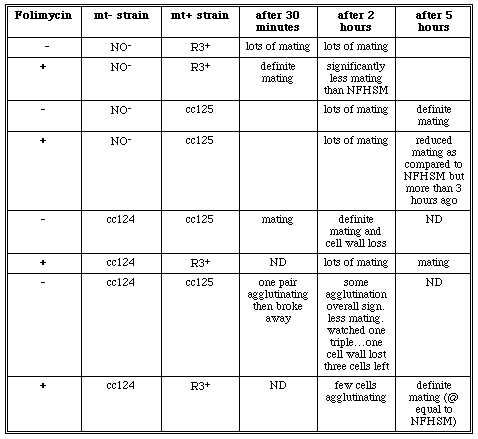
Table 9. Mating observations after cells had been made gametic in NFHSM and NFHSM, DMSO, and Folimycin. Gametic mt+ cells and mt- cells were mixed after 2 and 5 hours (ND= not determined).
Thus, the third time this experiment was performed, cells were quantified using a hemacytometer in order to have a more accurate account of the drug's effects on the cells (Table 10). After thirty minutes, the cc124 and cc125 cells were mixed and agglutination was assessed. The number of mating pairs of folimycin treated cells was not much less than the number of mating untreated cells (e.g.15-8, 20-11, etc.). However, after 2.5 hours under constant illumination, thenumber of folimycin treated mating pairs was significantly less than the number of mating pairs for the untreated cells (e.g. 15-25, 12-30, etc.). The biggest difference was recorded after 3.5 hours. The untreated cells had 50+ "agglutinating clumps" in each of the four field views observed; however, the treated cells had a noticeably lower number of "clumps."
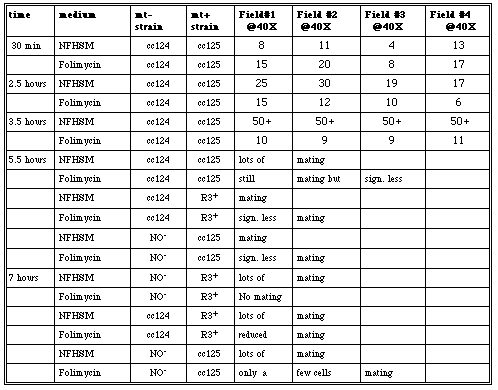
Table 10. Mating observations for treated and untreated cc124, cc125, NO- and R3+ cells. Four different fields were observed at 40X and the number of mating pairs were counted after 30 minutes, 2.5, 3.5, 5.5, and 7 hour.
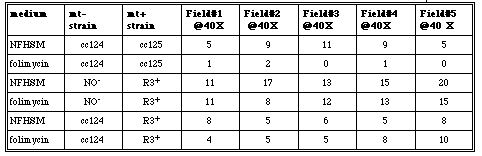
Table 11. Mating observations for treated and untreated cc124, cc125, NO- and R3+ cells. Five different fields were observed at 40X and the number of mating pairs were counted after one hour and 30 minutes.
A last attempt using the folimycin to chemically mimic the GA1 phenotype was made by varying the concentration of folimycin in the solutions. No differences in mating among any of the strains of cells were seen after 1.5 hours (Table 12). Therefore, we decided to abdandon the folimycin experiments as well.
|
folimycin |
wt- strain |
wt+ strain |
Field#1 @40X |
Field#2 @40X |
Field#3 @40X |
Field#4 @40X |
Field#5 @40 X |
|
- |
NO- |
R3+ |
15 |
20 |
17 |
11 |
13 |
| .4 µl |
NO- |
R3+ |
13 |
20 |
17 |
11 |
13 |
| .8 µl |
NO- |
R3+ |
12 |
16 |
18 |
11 |
9 |
| - |
cc124 |
cc125 |
10 |
12 |
11 |
13 |
8 |
| .4 µl |
cc124 |
cc125 |
8 |
7 |
9 |
6 |
5 |
| .4 µl |
cc124 |
R3+ |
10 |
6 |
8 |
12 |
9 |
| - |
cc124 |
R3+ |
12 |
11 |
8 |
10 |
13 |
Table 12. Mating observations for treated and untreated cc124, cc125, NO- and R3+ cells. Five different fields were observed at 40X and the number of mating pairs were counted after 1.5 hours.
At this point in our experimentation, more of the cDNA had been sequenced which revealed that GA1 is more similar to a plasma membrane H-ATPase. Therefore, our efforts to try and chemically mimic the GA1 phenotype were abandoned
III. Tetrad Analysis
To further characterize GA1 in terms of its chromosomal location and to determine whether or not mt+ strains of C.reinhardtii could have the GA1 phenotype, tetrad analysis was performed. The results from the tetrad analysis in this experiment indicate that we did not have tetrads because all four colonies for each "tetrad" were of the same mating type. If they were true tetrads, two of the strains should have been mt- and two should have been mt+. Because tetrad analysis is very time consuming, we decided to focus our extra efforts on subcloning the rest of the gene.