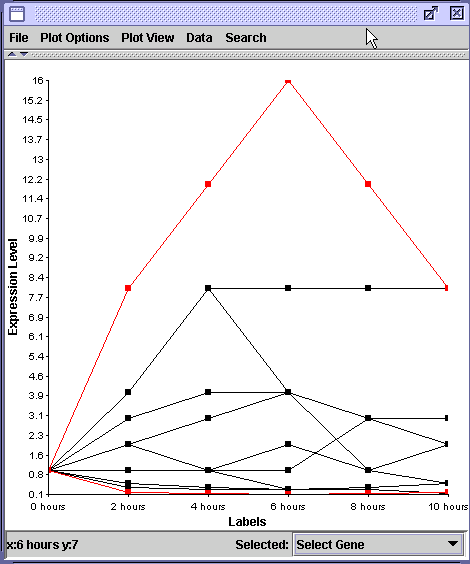
What we want to be able to do is compare the change in transcription, or expression, for different genes. However, if we only use the ratios, it becomes difficult to compare directly. For example, consider the case below, where the expression levels of several genes are plotted over time:

In this example, all genes began at 1 fold, or baseline levels. Two genes have been highlighted in red. Which one changes its expression the most? From the graph, it appears that the upper gene did when it was transcribed 16 times more at 6 hours than at 0 hours. The bottom red gene went from 1.0 to approximately 0.1 which appears to be a minor change in transcription.
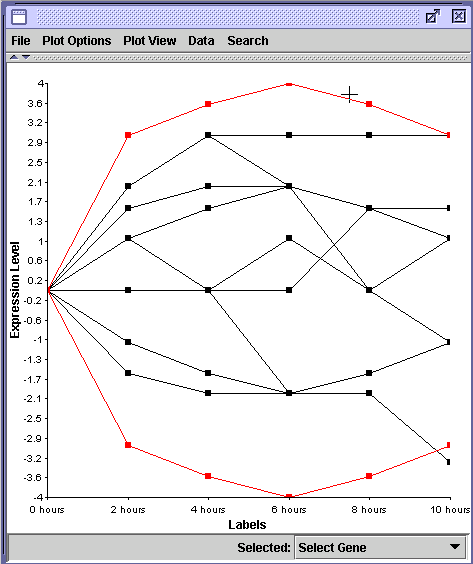
However, if all data are log2 transformed as shown below, you can discover that the two genes changed their transcription levels by the same amplitude but in opposite directions. Remember that increased transcription of 16 = 24 which is equivalent to log2 of 4. Conversely, gene repression of 16 fold is equal to log2 of - 4 (1/16 = 16-1 = 2-4) . By log2 transforming the ratios (16 and 1/16), we can more easily measure the degree to which different genes alter their transcription.

One last point, when you want to compare expression levels of every gene in a genome, you should always log transform your data. This will facilitate the calculation of genes with high similarity (i.e. correlation) of expression patterns.