This web page was produced as an assignment for an undergraduate course at Davidson College.
Yeast Expression Profiles for GSH1 and SET4
In my previous project, I found two yeast genes, GSH1 and SET4, and investigated what is known about them. GSH1 is a gene known to be involved in free radical removal and extra-mitochondrial protein modification. SET4 is an ORF with an unknown function, but which I predict to bind histones, and possibly methylate DNA and silence genes. In this project, I will investigate publically available microarray data for both GSH1 and SET4. By doing so, I hope to see how these two genes are regulated under different experimental conditions and how other genes they cluster with. This may help me further deduce a possible function for SET4.
What are Microarrays?
Within the past 10 years, biological research has been revolutionized by a new technology called microarrays. Microarrays are small slides which contain thousands of small genetic probes. Each probe is designed to bind a specific genetic sequence, either mRNA, DNA, or cDNA. Fluorescently labeled mRNA or DNA is washed over the surface of the microarray chip, and any complementary sequences will bind each other. By convention, the control condition will be labeled green, and the experimental condition will be labeled red.
By looking at the fluorescent spots, we can see which mRNA or DNA was present under which conditions. We can then compare the amount of genetic material present in one condition versus another condition. A spot on the array with more genetic material in one condition will show up brighter than in another condition. A yellow spot has equal amounts of DNA from both conditions.
Whereas in the past scientists could only measure the presence of specific mRNAs or DNAs using slow gels, today it is possible to do so quickly and on a much larger scale thanks to microarrays. Generally speaking, biologists use mRNA to measure gene expression under different conditions and use DNA to compare the amount of chromosomal DNA present in different samples.
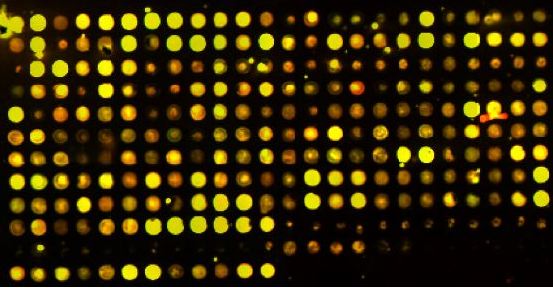
Figure 1: A microarray chip (Davidson College, permission granted).
Many microarray experiments have been performed on yeast, S. cerevisiae, and the data from these experiments is publically available through online databases, such as the Saccharomyces Genome Database. To visualize the results, a color scale is used. Green indicates repression, and red indicates induction. Black spots are neither repressed nor induced.
Figure 2: Color scale used throughout the yeast genome database website. The green to the far left represeents repression by a factor of 2.8, and red to the far right represents induction by a factor of 2.8, compared to the control condition (Yeast Genome Database).
What is Gene Clustering?
With the large influx of gene expression data, it quickly became difficult to understand what it all meant. Computational tools were developed to cluster genes and experimental conditions based upon their similarities. The most common ways of doing this are using hierarchical clustering and the Pearson correlation coefficient, although other methods exist too. These include K-means, SOM, and PCA clustering, and Euclidean distance, Spearman Rank, and Kendall's tau comparison metrics. The yeast genome database uses hierarchical clustering and the Pearson correlation coefficient.
If two genes cluster together, this means that they have similar expression profiles under certain experimental conditions. The establishment of a correlation allows us to make predict a relationship between the two genes via a "guilt by association." This relationship can then be tested in the lab for validity.
GSH1
As described in my Favorite Yeast Genes page, γ-glutamylcysteine synthase is an annotated yeast gene with known functions and ontologies. By looking at the gene expression profiles for this gene, I will investigate how its annotation compares with experimental evidence.
There are many different experiments available to browse. Instead of looking at every single experiment, I will pick out a few experiments which I either expect to relate to cellular detoxification, or which appear to exhibit the strongest responses.
Peroxisome Induction and Repression
Peroxisomes are cellular organelles which dispose of toxic substances, such as hydrogen peroxide. Experiments were performed where peroxisomal formation was induced. They recorded the gene expression under these conditions using microarrays (Smith et al., 2002).
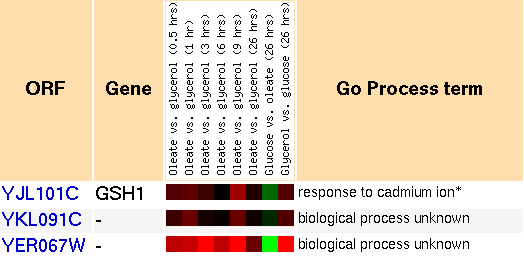
Figure 3: Snapshot of gene expression in response to peroxisome induction and repression (Yeast Genome Database).
GSH1 clusters with a lot of genes in these experiments. Most of them have annotations and do not fall into any one category. This probably means that many pathways are involved with the peroxisome creation process. Since GSH1 acts as a detoxification agent, it is quite likely that it is present in significant quantities within peroxisomes. I do not understand what the categories mean, "oleate vs glycerol." Oleate is just a common fatty acid (Wikipedia, 2006). Perhaps it stimulates the production of peroxisomes.
Environmental changes
Experiments were performed on S. cerevisiae which exposed it to a wide variety of stressful conditions. These conditions include heat/cold shock, hydrogen peroxide, various types of starvations, and other stressful conditions (Gasch et al., 2000).
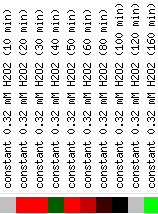
Figure 4: Snapshot of gene expression under hydrogen peroxide stress (Yeast Genome Database).
Hydrogen peroxide is one of the known producers of free radicals which glutathione can protect cells against. As we would expect, GSH1 was induced in the presence of hydrogen peroxide. By 160 minutes, it was strongly repressed, indicating perhaps that there was so much γ-glutamylcysteine and glutathione produced that the hydrogen peroxide levels were kept under control. Alternatively, the cells were dying and thus unable to transcribe anymore.
In these experiments, GSH1 did not cluster with any other genes. GSH1 also was strongly induced in the presence of menadione, diamide, and amino acid starvation. It was repressed during heat shock (not shown). Perhaps heat reduces the toxicity or presence of free radicals, thus reducing the need for glutathione.
Arsenic
The GO annotation for GSH1's "Process" is "response to cadmium ions." GSH1 is also thought to interact with other heavy metals as well. Arsenic is a heavy metal known to cause cancer in humans. Experiments were performed which measured yeast's response to the presence of various concentrations of arsenic. As it turns out, the scientists who performed the experiments with arsenic have shown that it interacts indirectly with glutathione by causing oxidative stress (Haugen et al., 2004).
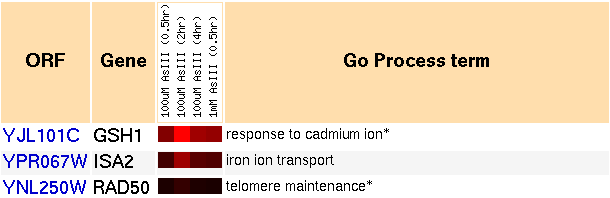
Figure 5: Snapshot of gene expression cluster for GSH1 when exposed to arsenic, over time (Yeast Genome Database).
As depicted in the image, GSH1 was induced by the presence of arsenic. It also clusters with genes involved with the following GO processes:
- iron ion transport,
- telomere maintenance,
- regulation of transcription from RNA polymerase II promoter,
- regulation of cell size,
- cytokinesis,
- mitochondrion organization and biogenesis,
- cell wall organization and biogenesis,
- transposition, RNA-mediated,
- response to oxidative stress,
- ribosome biogenesis,
- peptidyl-diphthamide biosynthesis from peptidyl-histidine,
- protein catabolism, and
- protein biosynthesis.
There is no clear pattern in the relationship between all these functions. A lot of these genes are involved with biogenesis, so perhaps these genes act together as a means of performing repairs. Arsenic is a nonmutagenic carcinogen (Haugen et al., 2004), so perhaps it causes cancer by damaging other parts of the cell, such as cell walls, ribosomes, miscellaneous proteins, and the mitochondria.
SET4
Since GSH1 is an annotated gene and well-understood, analysis of its expression patterns is less likely to give us more information about its function in yeast. SET4, however, is a gene with no annotated functions. By looking at its expression profiles, and through comparisons of how it clusters with other yeast genes, I can make an educated guess for its function through "guilt by association."
Sporulation
This experiment was performed with the intent on observing the process that yeast undergoes when it sporulates. This is done through the conversion of diploid cells to haploid cells, and includes meiosis and spore morphogenesis (Chu et al., 1998).
One of my predictions for SET4 was that it represses genes, and that it might play a role in sporulation. With the availability of gene expression data for sporulation experiments, I thought this would be an interesting place to start. SET4 clusters with over 20 genes, most of which have unknown functions or biological processes. The general trend in all these genes, compared to the control, is they are repressed for the first 30 minutes, the same for hours 2-5, and then induced in hours 7-9. They are the same at hour 11.
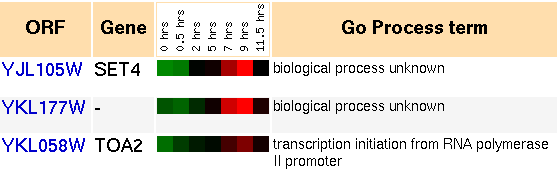
Figure 6: Snapshot of gene expression cluster for SET4 during sporulation (Yeast Genome Database).Based on this information, it appears that SET4 and a host of other genes participate in a distinct cellular mechanism during sporulation. The grouping of genes is first repressed, and within a few hours it is induced. To gain some better understanding of what this process is, I can look at some of the genes in the cluster and see what they do:
- transcription initiation from RNA polymerase II promoter,
- telomere maintenance,
- transcription, DNA-dependent,
- chromatin remodeling,
- basic amino acid transport,
- transcription from RNA polymerase II promoter,
- cation transport, and
- mitotic spindle organization and biogenesis in nucleus.
Almost all the annotated genes in the cluster have functions which relate to the chromosome. The roles range from transcription to transport to chromosomal organization and maintenance. During meiosis, there is a lot of chromosomal rearrangement that takes place. Although a precise function cannot be deduced for SET4, the microarray experimental results support the idea that it is involved with the chromosome and perhaps either carries a transcriptional, maintenance-related, or structural modification role.
Histone Depletion
This experiment was performed to investigate the mechanisms of the Silent Information Regulator (SIR) complex and of the nucleosome. By removing histones, 15% of genes were induced, and 10% of genes were repressed, with the remaining 75% of all genes being unaffected. Wyrick et al. found that histones tend to be gene-specific rather than generic repressors (Wyrick et al., 1999).
Another one of my predictions was that SET4 binds to histones. This was largely based upon the presence of conserved domains with other proteins. By looking at a histone depletion experiment, I expect to see some interesting results. The removal of histones should prevent the repression of many genes, which could lead to undesirable consequences. If other genes were upregulated as a secondary repressor mechanism, the consequences of histone removal could be dampened.
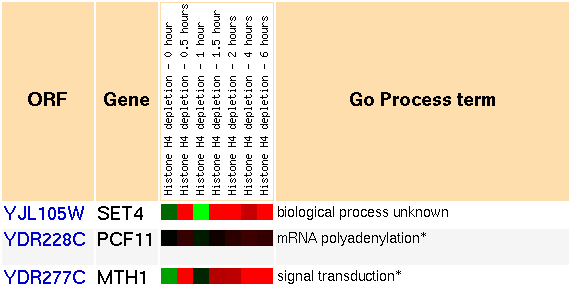
Figure 7: Snapshot of gene expression cluster for SET4 during histone depletion (Yeast Genome Database).
The expression patterns we see are somewhat unusual. At first, the genes in the cluster are repressed slightly. At 30 minutes, they are strongly induced. Then at 1 hour, they are repressed strongly. Then for the next time points at 1.5, 2, 4, and 6 hours, the genes are strongly induced. Futhermore, most of the genes in the cluster follow this trend very closely. Here is a short list of the annotated genes in the cluster:
- mRNA polyadenylation,
- signal transduction,
- galactose catabolism,
- response to stress,
- protein amino acid phosphorylation,
- synapsis,
- DNA repair, and
- nucleotide-excision repair, DNA damage recognition.
As predicted, SET4 shows a strong transcriptional response under conditions with histones removed. However, the response is somewhat ambiguous, as the genes alternate between strong induction and repression over a short period of time. I would usually expect a steady change from repression to induction. Nevertheless, a strong response correlates with a related function, and this supports SET4's relation to histone interaction and role as a gene silencer.
Comparison with the other genes in the cluster is not as informative as it was in the sporulation experiments. The genes in the cluster seem to do all sorts of things which are only vaguely related to one another. Thus interpretation of this microarray data does not lend itself to ascribing any new functions to SET4, although it still supports that histone interaction and gene silencing are key components of SET4's functions.
Conclusions
Through the analysis of publically available microarray data, I have been able to investigate the expression of two genes in S. cerevisiae. GSH1, an annotated gene, is known to be involved in the detoxification of the cell in the presence of hydrogen peroxide and heavy metals. It has also been hypothesized to modify certain extra-mitochondrial proteins (see this page for more information). By looking at the expression data for GSH1, I have confirmed that expression of GSH1 is induced in the presence of toxic substances. It is also induced during the proliferation of peroxisomes. It clusters with a lot of different types of genes, perhaps in cellular repair mechanisms. It is interesting to note that GSH1 does not cluster with GSH2, the gene required for the second step of glutathione synthesis. Since the two genes take part in the same pathway, I would have expected them to be expressed similarly.
Whereas GSH1 has an annotated function, SET4 does not. By looking at its expression data in different conditions, I have been able to confirm and modify my previous predictions as to what SET4 does. I had confirmed SET4 to be involved in histone binding and gene silencing, potentially through epigenetic means. I had also predicted SET4 to be somehow involved in sporulation. The expression data confirms that altering the histone content of the cell induces SET4, and that SET4 is regulated at specific time points during sporulation. SET4 clusters with a lot of genes which relate to chromosomal maintenance and modification. I did not gain more information about whether or not SET4 methylates DNA. It is interesting to note that SET4 does not cluster with SET3, the paralog in yeast that helped me deduce possible roles SET4 plays.
References
Online Abstracts
Chu, S, J DeRisi, M Eisen, J Mullholland, D Botstein, PO Brown, and I Herskowitz. The transcriptional program of sporulation in budding yeast [abstract]. In Science, 1998, 282(5389):699-705. SGD Curated Paper. <http://db.yeastgenome.org/cgi-bin/reference/reference.pl?dbid=S000055354> Accessed 2006 Oct 19.
Gasch, AP, PT Spellman, CM Kao, O Carmel-Harel, MB Eisen, G Storz, D Botstein, PO Brown. Genomic expression programs in the response of yeast cells to environmental changes [abstract]. In Mol Biol Cell 2000, 11(12):4241-57. SGD Curated Paper. <http://db.yeastgenome.org/cgi-bin/reference/reference.pl?dbid=S000059106> Accessed 2006 Oct 19.
Haugen, AC, R Kelley, JB Collins, CJ Tucker, C Deng, CA Afshari, JM Brown, T Ideker, B Van Houten. Integrating phenotypic and expression profiles to map arsenic-response networks [abstract]. In Genome Biol 2004, 5(12):R95. SGD Curated Paper. <http://db.yeastgenome.org/cgi-bin/reference/reference.pl?dbid=S000080191> Accessed 2006 Oct 19.
Smith, JJ, M Marelli, RH Christmas, FJ Vizeacoumar, DJ Dilworth, T Ideker, T Galitski, K Dimitrov, RA Rachubinski, JD Aitchison. Transcriptome profiling to identify genes involved in peroxisome assembly and function [abstract]. In J Cell Biol 2002, 158(2):259-71. SGD Curated Paper. <http://db.yeastgenome.org/cgi-bin/reference/reference.pl?dbid=S000070290> Accessed 2006 Oct 19.
Wyrick, JJ, FC Holstege, EG Jennings, HC Causton, D Shore, M Grunstein, ES Lander, and RA Young. Chromosomal landscape of nucleosome-dependent gene expression and silencing in yeast [abstract]. In Nature 1999, 402(6760):418-21. SGD Curated Paper. <http://db.yeastgenome.org/cgi-bin/reference/reference.pl?dbid=S000055640> Accessed 2006 Oct 19.
Online References
Oleate. Wikipedia, 2006. <http://en.wikipedia.org/wiki/Oleate> Accessed 2006 Oct 19.
Yeast Genome Database. 2006. Expression Connection. <http://db.yeastgenome.org/cgi-bin/expression/expressionConnection.pl?orf=YJL101C&dataset=peroxisome&type=similar> Accessed 2006 Oct 19.
Yeast Genome Database. 2006. GIF Image - 400x48 Pixels. <http://db.yeastgenome.org/images/scale.1.5.gif> Accessed 2006 Oct 19.
Yeast Genome Database. 2006. Expression Connection. <http://db.yeastgenome.org/cgi-bin/expression/expressionConnection.pl?orf=YJL101C&dataset=stressResponse&type=similar> Accessed 2006 Oct 19.
Yeast Genome Database. 2006. Expression Connection. <http://db.yeastgenome.org/cgi-bin/expression/expressionConnection.pl?orf=YJL105W&dataset=sporulation&type=similar> Accessed 2006 Oct 19.
Yeast Genome Database. 2006. Expression Connection. <http://db.yeastgenome.org/cgi-bin/expression/expressionConnection.pl?orf=YJL105W&dataset=histone&type=similar> Accessed 2006 Oct 19.