Results of Mac DNAsis
analysis
for 1,6 Fructose Bisphosphate Aldolase
(This web page was produced as an assignment for an undergraduate
course at Davidson College. )
Open Reading Frame (ORF)
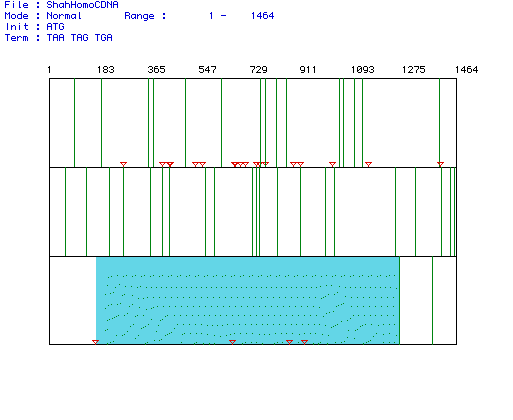
Figure 1: Open Reading Frame analysis of the cDNA
for the protein 1,6 Fructose Bisphosphate Aldolase in the species Homo
sapiens. Red triangles represent start codons and vertical green
lines indicate stop codons. The blue box highlights the largest open
reading frame. This ORF is from nucleotides x-x and codes for a protein
with a molecular weight of 39,417.91 Daltons.
Hydrophobicity (Kyte and Doolittle plot)
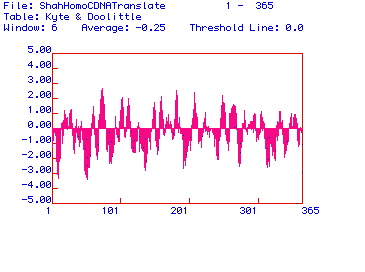
Figure 2: Kyte and Doolittle Hydrophobicity plot of the Homo
sapien 1,6 FBP Aldolase. There are 4 peaks on the graph
which reach a Y-axis value of 2.00 or greater, indicating portions of the
protein hydrophobic enough to reside in a phospholipid bilayer. These
points occur near positions 80, 190, 210, and 260. These data
suggests that the protein is an integral membrane protein.
Antigenicity (Hopps and Woods plot)
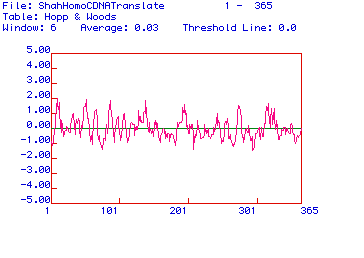
Figure 3: Hopps and Woods antigenicity plot for Homo sapien
1,6 FBP Aldolase. Highly hydrophilic regions (indicated by high Y-axis
values) represent possible good epitope sites. This particular plot
suggests that amino acid regions around points 10, 70, 100, 140-150, and
310-330 would be good epitopes to create an antibody for.
Predicted Secondary Structure
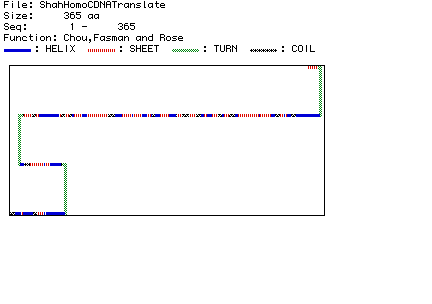
Figure 4: Predicted secondary structure of Homo sapiens 1,6 FBP
Aldolase using Chou, Fasman, and Rose analysis. Click here
to compare this prediction to a Rasmol
Image of Human 1,6 FBP Aldolase.
Multiple Seqeunce Alignnment
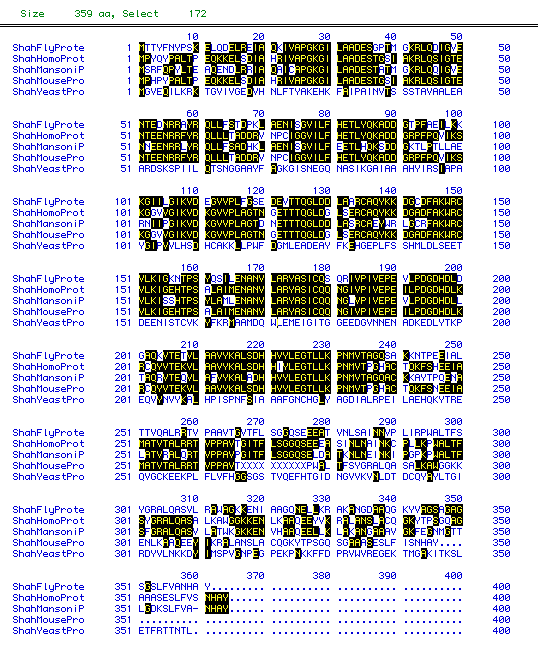
Figure 5: Multiple sequence alignment for 1,6 FBP Aldolase
from 5 different species: Drosophila
melanogaster, Homo
sapiens, Mus
musculus, Saccharomyces
cerevisiae, and Schistosoma
mansoni. Amino acids are compared with Black boxes indicating
residues common between 2 or more species at a given position along the
polypeptide chain. To see the full amino acid sequence for a species,
click on its name.
Phylogenetic Tree

Figure 6: Phylogenetic tree of 1,6 FBP Aldolase from Drosophila
melanogaster, Homo
sapiens, Mus
musculus, Saccharomyces
cerevisiae, and Schistosoma
mansoni. MacDNAsis created this phylogenetic tree based on amino
acid conservation over time between the different species.
To view the complete amino acid sequence for a species, click on its name.
Click to return to my Main
Page
Click here to return to the Molecular Biology
Home Page
Send comments, questions, and suggestions to: shcounts@davidson.edu