MacDNAsis Results for Pyruvate kinase
Timothy S. Deeb
Molecular Biology
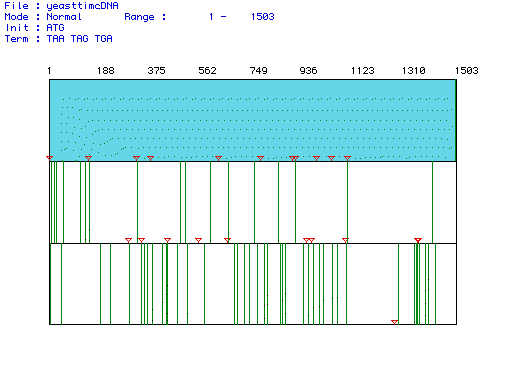
Figure 1. Largest open reading frame (ORF) of Saccharomyces cerevisiae
Pyruvate kinase. MacDNAsis was used to produce this analysis of the different
reading frames of Pyruvate kinase cDNA from the Saccharomyces
cerevisiae gene. The blue segment is the largest ORF and begins with
the start codon marked by a red triangle at nucleotide 1 and continues
until nucleotide 1503 where a green line marks the stop codon.
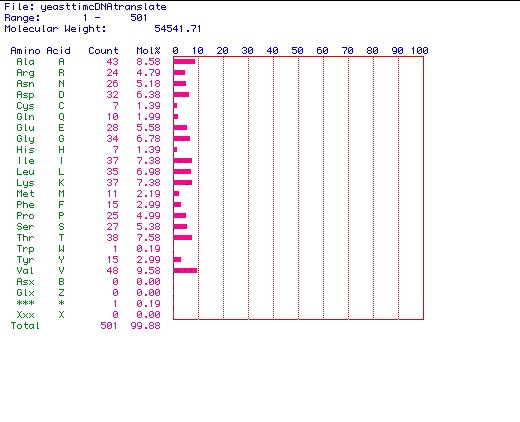
Figure 2. The amino acid content of Saccharomyces cerevisiae
Pyruvate kinase. MacDNAsis was used to determine the amino acid content
encoded by the above largest ORF from Saccharomyces cerevisiae Pyruvate
kinase (see figure 1) sequence. Saccharomyces cerevisiae Pyruvate
kinase contains 501 amino acid residues, and has a molecular weight of
54541.71 Daltons.
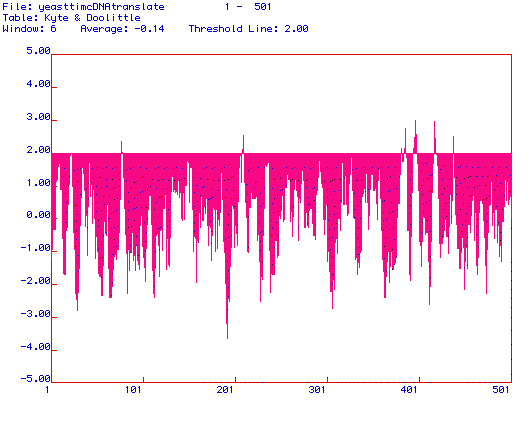
Figure 3. Kyte and Doolittle hydropathy plot of Saccharomyces cerevisiae
Pyruvate kinase. MacDNAsis was used to produce a hydropathy plot of Saccharomyces
cerevisiae Pyruvate kinase based on the hydrophobicity of the amino
acid residues. The X-axis represents the number of the amino acid within
the protein sequence, and the Y-axis represents the hydrophobicity of the
amino acid being analyzed. The regions where the hydrophobicity is greater
than 2.00 indicate integral membrane domains. Saccharomyces cerevisiae
Pyruvate kinase is likely an integral membrane protein, as suggested by
the numerous regions above the threshold line at 2.00.

Figure 4. Hopp and Woods antigenicity plot of Saccharomyces cerevisiae
Pyruvate kinase. MacDNAsis was used to produce an antigenicity plot of
Saccharomyces
cerevisiae Pyruvate kinase by demonstrating regions of hydrophilicity.
The X-axis represents the number of the corresponding amino acids within
the protein sequence, and the Y-axis represents hydrophilic (positive Y-values)
and hydrophobic (negative Y-values) regions of the protein sequence being
analyzed. This portion of the plot shows the most hydrophilic region that
indicates a potential epitope location which can be used in generating
a monoclonal antibody. The hydrophilic portion of the protein around amino
acid 193 could be used to generate a peptide and a monoclonal antibody
against the peptide which could recognize the epitope, while the protein
is in its native conformation.
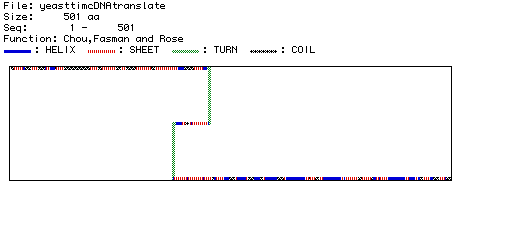
Figure 5. Chou, Fasman, and Rose prediction of Saccharomyces cerevisiae
Pyruvate kinase secondary structure. The secondary structure of Saccharomyces
cerevisiae Pyruvate kinase was predicted by MacDNAsis. The predicted
secondary structures (helix, sheet, turn, and coil) are displayed using
different colors and patterns as shown in the legend.
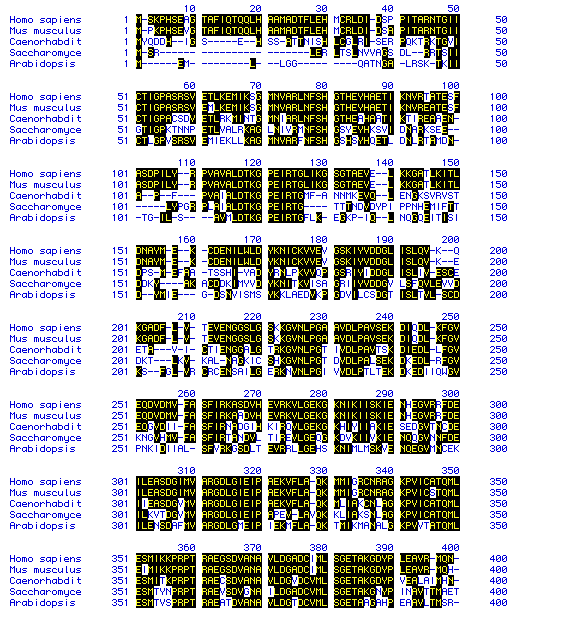
Figure 6. Multiple sequence Alignment of Pyruvate kinase. MacDNAsis
was used to perform a multiple sequence analysis (Higgins method) of the
following species: Homo
sapiens, Mus
musculus, Caenorhabditis
elegans, Saccharomyces
cerevisiae, and Arabidopsis
thaliana. This multiple sequence analysis highlights the
amino acid residues which are common to more than one species. Only the
amino acid residues from 1 to 400 are shown. A phylogenic tree of the species
according to Pyruvate kinase (Figure 7) was predicted by comparing these
residues.
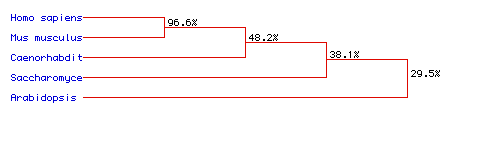
Figure 7. Phylogenic Tree illustrating the percentage of homology between the amino acid sequences of five different species: Homo sapiens, Mus musculus, Caenorhabditis elegans, Saccharomyces cerevisiae, and Arabidopsis thaliana. MacDNAsis was used to predict the phylogenic tree of the five different species (above) according to Pyruvate kinase. The two mammalian species, Homo sapiens and Mus musculus, have the most highly conserved amino acid sequences. Arabidopsis thaliana shows the least homology to the other protein sequences of the other species.