This website was produced as an assignment for an undergratuate course at Davidson College
Home safsaCurly Hair Gene dsafPaper Review 1sdaf Paper Review 2
What is PDZ? safsaScientific Article dsafConclusionssdaf
How Did MacBeath et al. Determine Interaction?
MacBeath et al. cloned, expressed, and purified 157 PDZ domains from the mouse genome. With these 157 domains, they created microarrays to test for interaction. Each domain was spotted four times. Because the PDZ domain is known to interact with the c-terminus of proteins, MacBeath et al. synthesized 217 fluorescent representative peptides, which consisted of ten c-terminus amino acids.
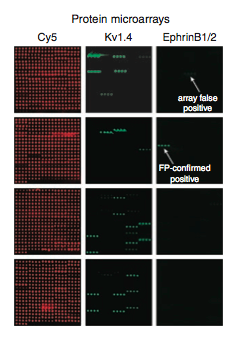
MacBeath et al. then ran microarrays in triplicate, on which they looked for a mean fluorescence of three times the median. Figure 3 shows representative images of the numerous microarrays they produced. Cy5 (red spots) shows that the spotting of all the PDZ domains was effective. Kv1.4 and EphrinB1/2 are two of the 217 peptides tested. An important thing to note is that positives occur in sets of four, which makes sense because each PDZ domain was spotted out four times.
Figure 3: Representative microarray data. Cy5 is a fluorescent dye used to measure the spotting of the PDZ domains. Kc1.4 and EphrinB1/2 are two of the 217 peptides tested.
On Figure 3 an array false positive and an FP-confirmed positive are indicated on the EphrinB1/2 microarray. Because microarrays are a high-throughput method, they have relatively high false positive and negative rates. To increase the accuracy of their model, MacBeath et al. used fluorescent polarization to correct for array false positives and negatives (Fig. 4).
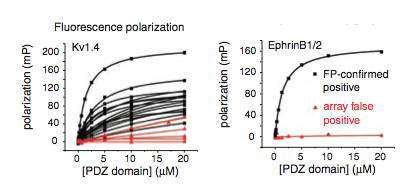
Figure 4: The results of fluorescent polarization for two different peptides, Kv1.4 and EphrinB1/2. Testing was done on all PDZ and peptide interactions the microarray detected. If polarization remains high, the interaction is considered FP-confirmed and the line is colored black. If the light becomes depolarized the interaction is considered an array false positive and the line is colored red.
What is Fluorescent Polarization?
Fluorescent polarization is another method to analyze protein-protein interaction (Fig. 5). The ligand, in this case the PDZ domain, is fluorescently labeled and excited with a plane-polarized light. Because of the excitement the ligand rapidly rotates and changes direction, thus causing the emitted light to be depolarized. If the protein added binds with the PDZ domain, rotation slows, and the emitted light remains polarized.
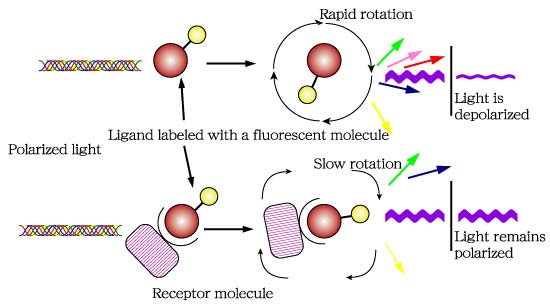
Image from Glycotechnology
Figure 5: Flourescent polarization works by measuring whether light remains polarized.
Did Fluorescent Polarization Help Refine The Model?
Using microarrays they observed that 127 of the PDZ domains interacted with at least one peptide, but using fluorescent polarization, they found only 85 PDZ domains which met their criteria (a dissociation constant of less than 100um). Once they had corrected for array false positives, MacBeath et al. created their first predictive model. With the model they predicted array false negatives, performed fluorescence polarization, corrected array false negatives, and retrained the model. Using fluorescent polarization MacBeath et al. found the microarray false negative rate to be 6.6%.
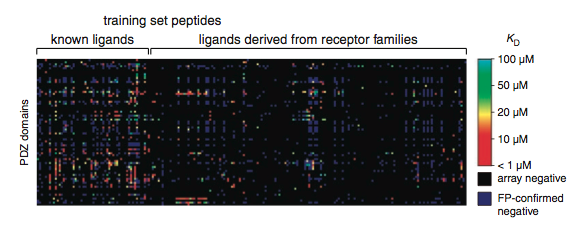
Figure 6: The results of fluorescent polarization for each array determined positive. Black spots were negative in the array, purple spots were positive in the array but were confirmed negative by fluorescent polarization. Colored spots range from red to green and indicate the degree of certainty about hte interaction from fluorescent polarization (dissociation constants).
How Accurate Is the Refined Model?
Once MacBeath et al. had revised their model three times, they used the refined model to predict the interactome between the PDZ domains and the training set peptides. The found that the model performed well, it correctly identified 516 of 536 (96%) true positives. Figure 7 is a graphical representation of their model testing. When the model predicted an interaction and there actually was one, the spot is red, if there was not one, the spot is green. When the model predicted no interaction and there was none, the spot is blue, if there was the spot is yellow.
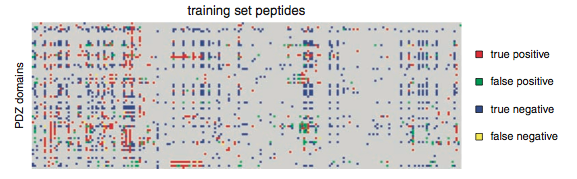
Figure 7: Results when the multidomain selectivity model was used to predict interaction between the PDZ domains and training set peptides. Red and blue spots indicate correct predictions by the model, while green and yellow spots indicate incorrect predictions.
What Factors Help Determine What the Model Will Predict?
The multidomain selectivity model contains a variable which accounts for the preference of different PDZ domains for different amino acids at certain positions. Figure 8 is heat map which displays the preference of the PDZ domains for amino acids at five c-terminal positions, 0, -1, -2, -3, and -4. If a particular amino acid contributes the binding at that position the spot is color a shade of yellow (brighter yellow represents a greater contribution). Conversely if an amino acid is a deterrent to binding at that position the spot is a shade of blue (brighter blue represents a greater deterrent to binding). Black spots represent positions at which that amino acid has neither a positive nor a negative effect on binding. As you can see the box representing the influence of peptide position zero contains primarily black spots, thus position zero does not contribute substantially the the probability of interactions vs. noninteraction.
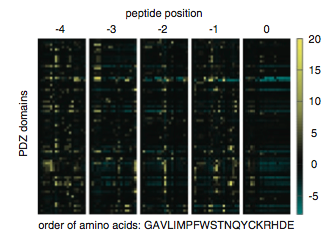
Figure 8: Colorful depiction of the effect of different amino acids at different positions on PDZ selectivity.
To help themselves categorize (and visualize) the many PDZ domains, MacBeath et al. used a modified version of the Markov cluster algorithm. The algorithm helped them discover four clusters of PDZ domains as well as the ligands to which they bind (Fig. 9). These cluster diagrams help visualize clusters (the claudins with ZO-1 and ZO-2 for example) as well as relationships between the clusters (the light gray lines).
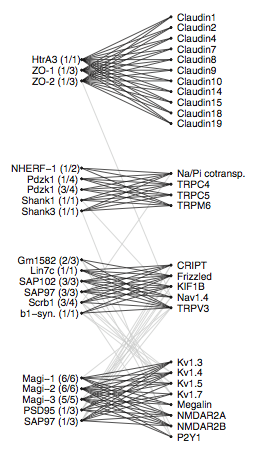
Figure 9: Markov clusters of the PDZ domains. Markov clustering returned four major "tight clusters."
MacBeath et al. used previously reported "z scales" to help classify what physiochemical properties of amino acids influenced binding or not binding at each position. Z1 is a measure of hydrophilicity, Z2 is a ratio of molecular weight/surface area, and Z3 is a ratio of polarity/charge. For most PDZ domains some combination of the three domains helps determine which amino acids are favorable or unfavorable to binding at a certain position. Figure 10 showcases three extreme examples where only one of the z scales is correlated with PDZ selectivity. At position 4 only Z1 is related (positively) to selectivity for Digh3. At the same position in Magi-1 only Z2 is related to selectivity, but it is a negative relationship. The relationship between Z3, position 4, and MUPP1 is also negative.
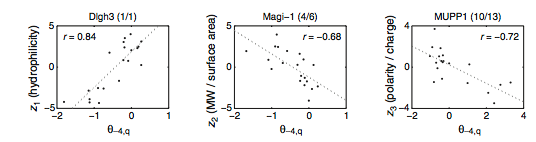
Figure 10: Relationship between "z scales" and extreme PDZ selectivity.
Figure 11 is a correlation matrix between all three z scales at positions -4, -3, -2, and -1 and all 74 PDZ domains. It is easy to see that at different positions certain z scales seem to be more or less important. For example the Z3 column for position -1 is primarily black, indicating that at position 1 the polarity/charge ratio of the amino acid is not the most important factor which determines interaction. As a general trend the intensity of either blue or yellow spots seems to be greater at position -4 than the other positions, especially in the Z1 column.
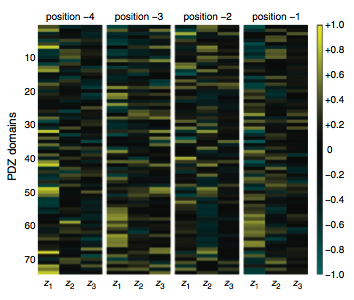
Figure 11: Correlation matrix between z scales at positions -4, -3, -2, and -1 and all 74 PDZ domains.
How Accurate is the MDSM on PDZ Domains Not in the Training Set?
To further test the accuracy of their model, MacBeath et al. chose 48 proteins from the mouse proteome that had not been included in the training set. These 48 proteins were predicted by the MDSM to be highly connected to PDZ domains, and therefore MacBeath et al. expected many interactions to occur. They performed fluorescent polarization analysis of the 48 proteins with 74 of the PDZ domains for a total of 3552 possible interactions. Of those 3552, 493 were interactions while 3059 were noninteractions. The MDSM model accurately predicted 48% of the interactions and 88% of the non interactions (Fig. 12). The receiver operating characteristic (ROC) curve depicted in Figure 10 shows the initial results of the MDSM model (black line), which is far above the dashed line that would be expected if the model was due to chance. MacBeath et al. also found that smoothing over the PDZs (green line) or PDZs and amino acids (red line) improved the MDSM model’s accuracy.
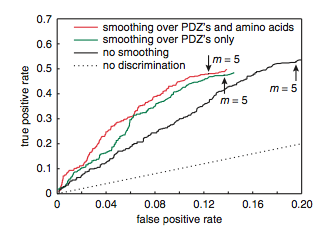
Figure 12: Receiver operating characteristic (ROC) curve. The MDSM model (black line) performs far better than would be expected by random chance (dashed line).
Can The MDSM Be Used to Classify PDZ Domains?
Using the correlation matrix they produced (Fig. 11), MacBeath et al. used singular-value decomposition and found that around ~74% of PDZ domain binding preferences can be explained by three principal axes (Fig. 13). The rest of PDZ selectivity can be explained by 9 other principal axes.
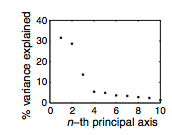
Figure 13: The percent of variance which is explained by each principal axis. MacBeath et al. chose to focus on the first three principal axes, as they explain ~74% of variation in PDZ domain binding selectivity.
The first three principal axes can disinguish between the three standard PDZ domains (Class I, Class II, and Class III).
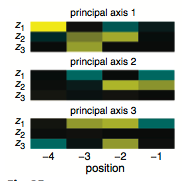
Figure 14: Graphical representation of the first 3 principal domains and their relation to z scales and positions -4, -3, -2, and -1.
MacBeath et al. were able to graph a selection of PDZ domains along the three principal axes (Fig. 15). Where each domain falls within the selectivity space helps classify that particular domain. For example classic Class I domains lie at the negative end of the first principal axis, which Class II domains lie at the positive end. MacBeath et al. emphasize the importance of the fact that they now see PDZ domains as laying along a continuum rather than divided into distinct classes. As can be seen in Figure 15, the domains are dispersed relatively evenly through the selectivity space.
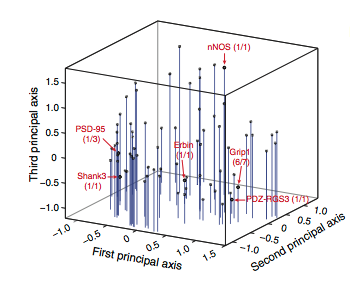
Figure 15: Three dimension graph of the PDZ domain selectivity space. The three principal axes account for ~74% of selectivity.
Finally, MacBeath et al. looked at the correlation between pairwise sequence divergence of the PDZ domains and their distance between one another in the selectivity space (Fig. 16). They found a rather weak correlation (r=0.23) which means that in general looking at just the sequence of the domain is not a good way to predict what peptides it will bind with.
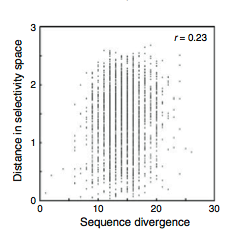
Figure 16: The correlation between PDZ domains with high sequence similarity and their position in the selectivity space.