This web page was produced as an assignment for an undergraduate course at Davidson College.

CAT8 & YMR279C: My Favorite Yeast Genes

Part II: Analysis with Expression Profiles

    The free-access ethos pervading microarray technology and the massive jungle of experimental data that first sprouted in its wake 10 years ago are at the heart of genomics. Microarrays are fundamentally good at sampling the expression patterns of genes in a highly parallel manner, making experiments based on whole-genome surveys not just possible, but practical and economical. Public databases have been deluged with data ever since, and it is actually becoming more expensive and difficult to successfully organize all the data logically than physically. Join us as we set sail across that sea of data in Part II, fishing for more clues to the function and ontology of YMR279C & CAT8.

    In part I we investigated the function of the S. cervisiae genes CAT8 and YMR279C using existing literature0, ontology & sequence databases such as the Saccharomyces Genome Database, and a variety of in silico methods such as BLAST to identify other genes with similar sequences. By assuming that function follows form (in the microscopic world, at least), we could infer some of the functions of our genes from any results that had already been annotated. This strategy can be extended for use with expression patterns: if gene A is well understood and gene B unknown, but both share a great deal of similarity in expression, then perhaps both participate in the same cellular process. This reasoning process is generally called "guilt by association" and increases in power with the similarity and number of expression patterns. Clustering functionally-similar genes based on expression profile can include genes that a BLAST method would ignore, if they were functionally related but composed of totally different sequences.

On the other hand, we could forgo the other genes completely and just look at how the expression levels of those genes in which we are interested react to a comprehensive battery of tests like heat/cold shocks, changes in nutrition, starvation, drawing conclusions about their functions based on their individual response. But the technology to look at single-gene expression has been around for some time now, and the real strength of microarray experiments is in their ability to reveal trends and patterns between many groups of many genes.

Fig 1. A small section of a scanned microarray (source: wikipedia)


CAT8

Fig 2. A histogram showing that CAT8 usually doesn't experience radical fold changes in expression level in
SGD's collection of microarray experiments . Courtesy of the Saccharomyces Genome Database (SGD) 2005.

    CAT8's Molecular Function is officially annotated as having "Specific RNA polymerase II transcription factor activity" and it's Biological Process being involved with "Positive regulation of gluconeogenesis." Before attempting to devine functional information for YMR279C (of which we know very little) from expression data, let's test out the technique on CAT8.

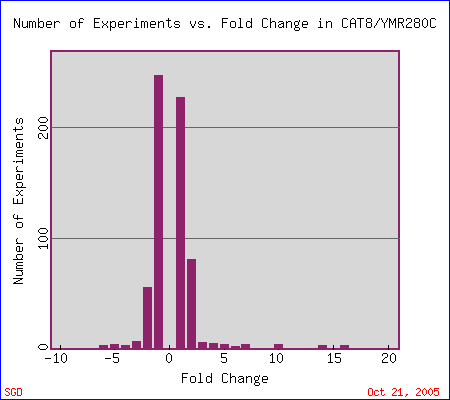
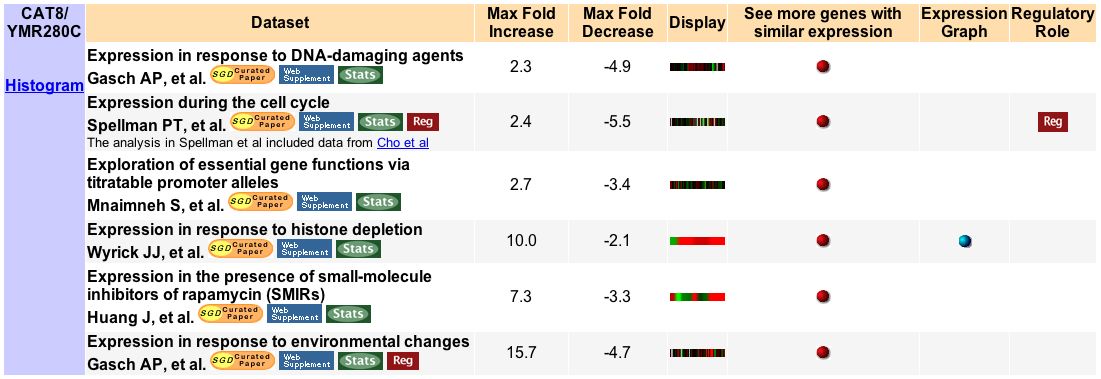
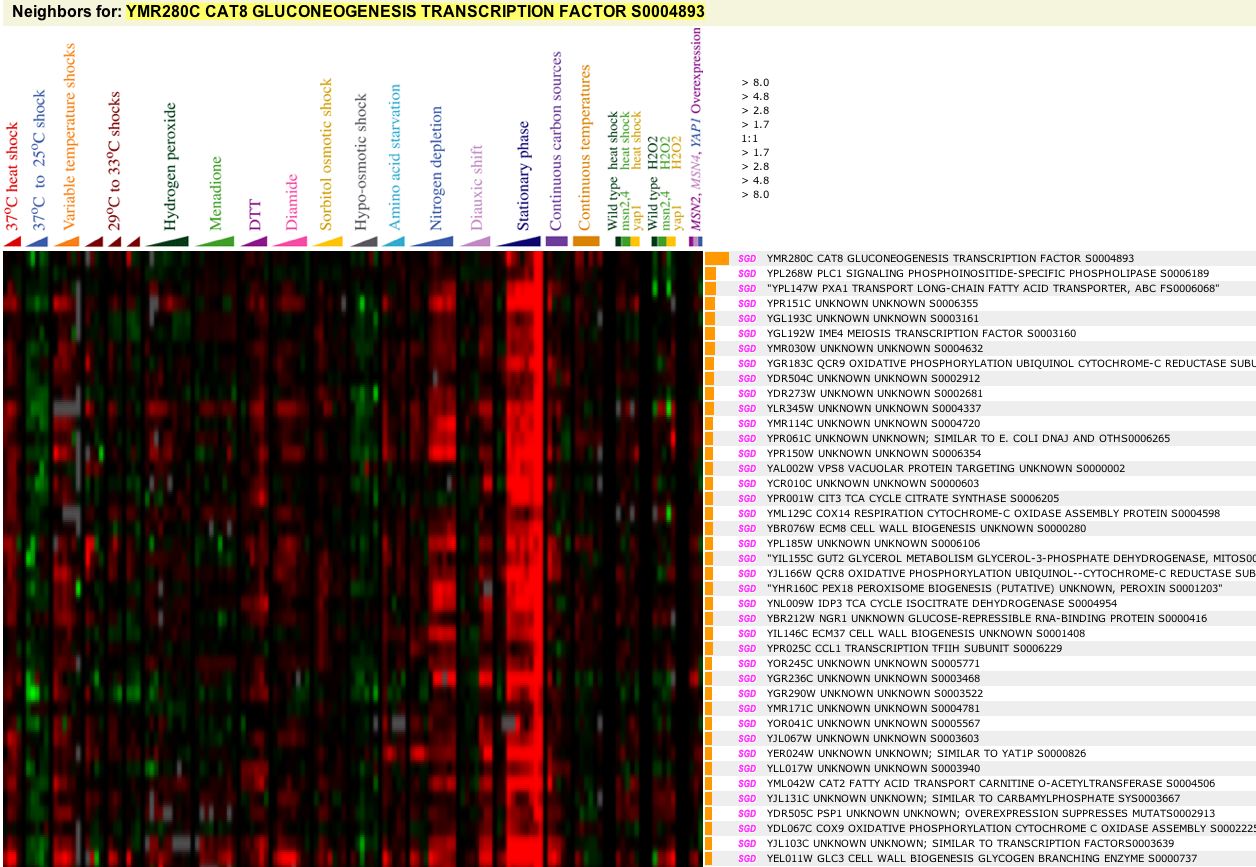
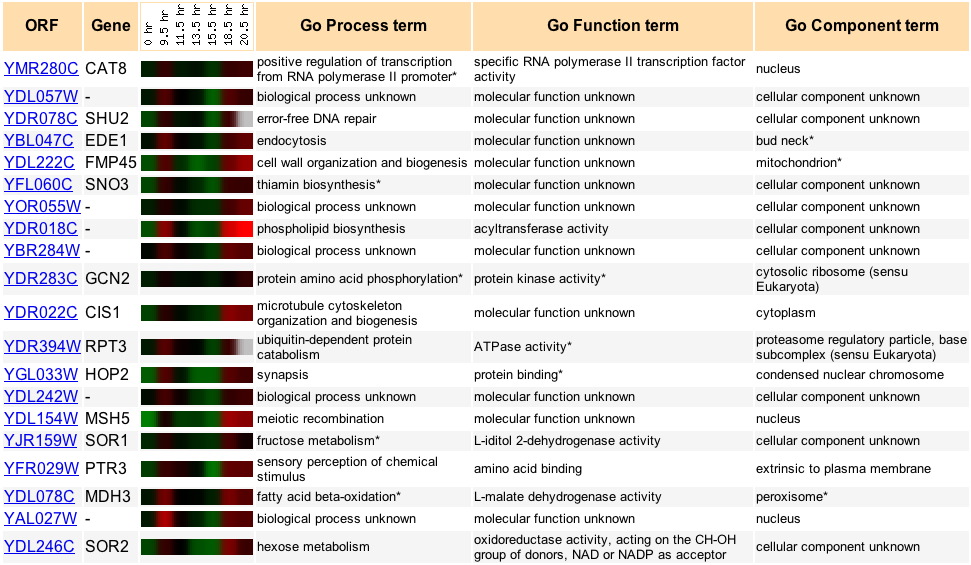
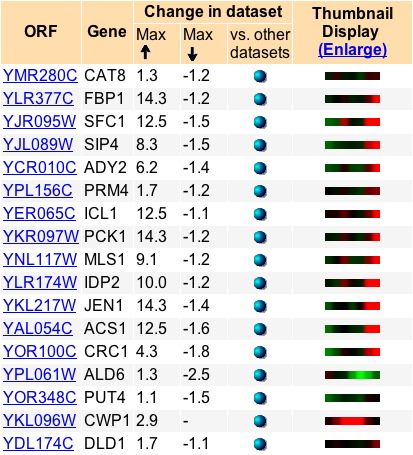
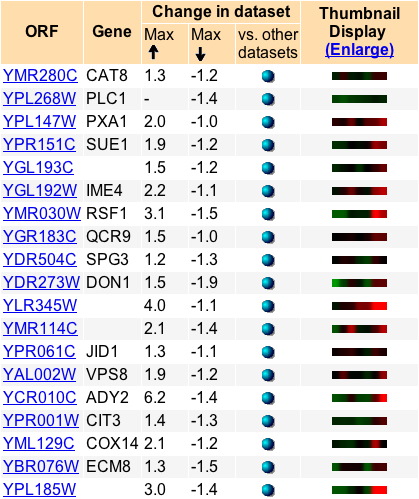
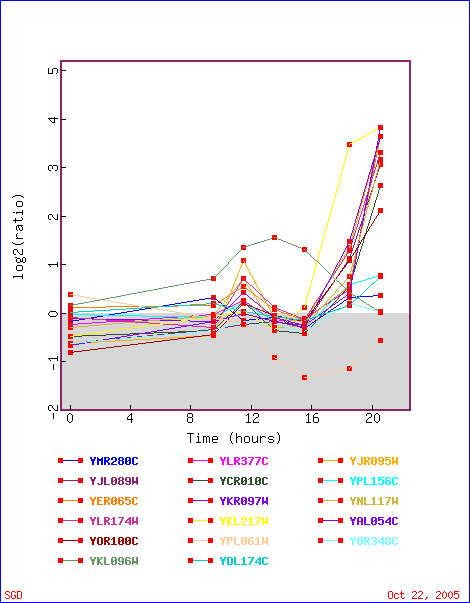
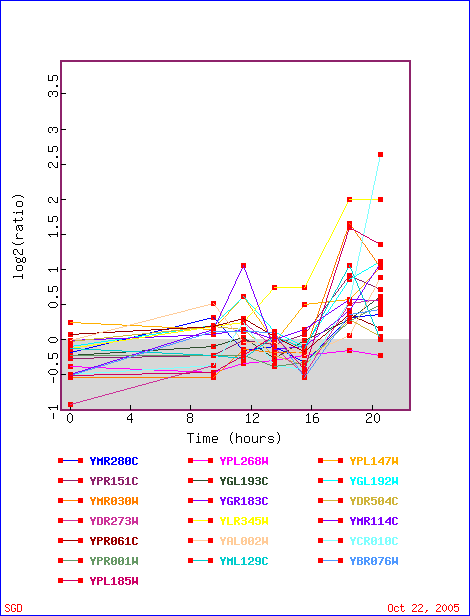
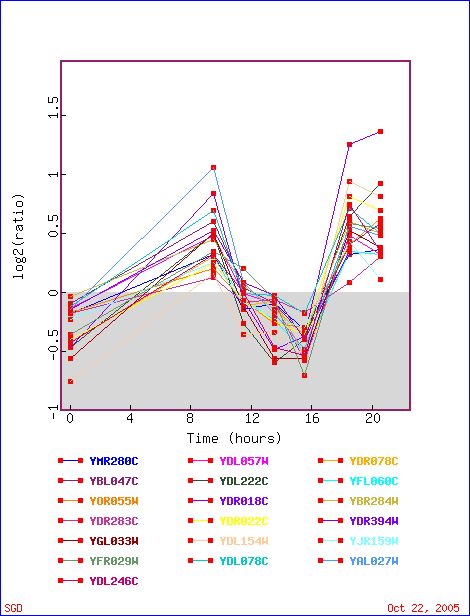
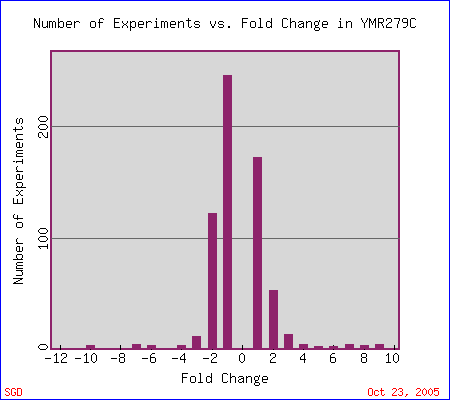
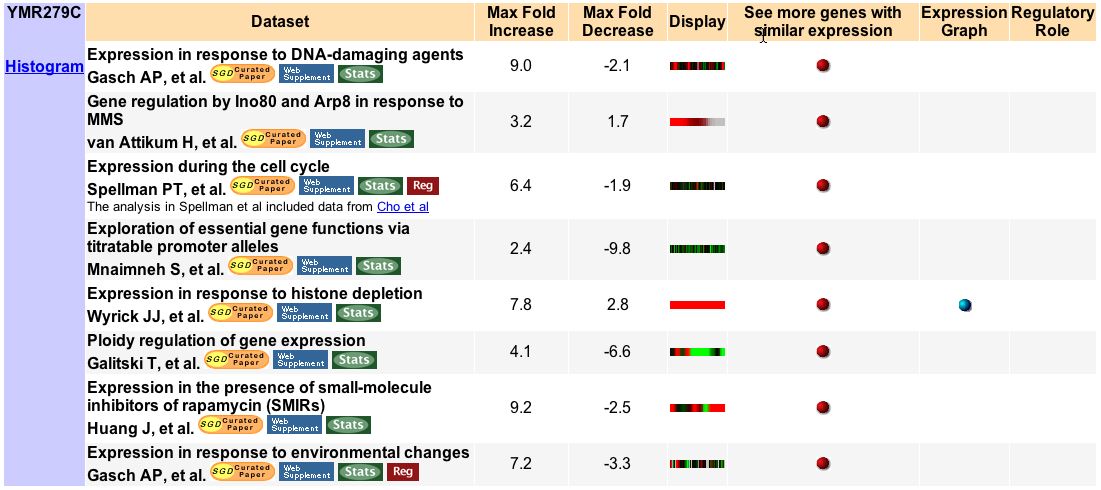
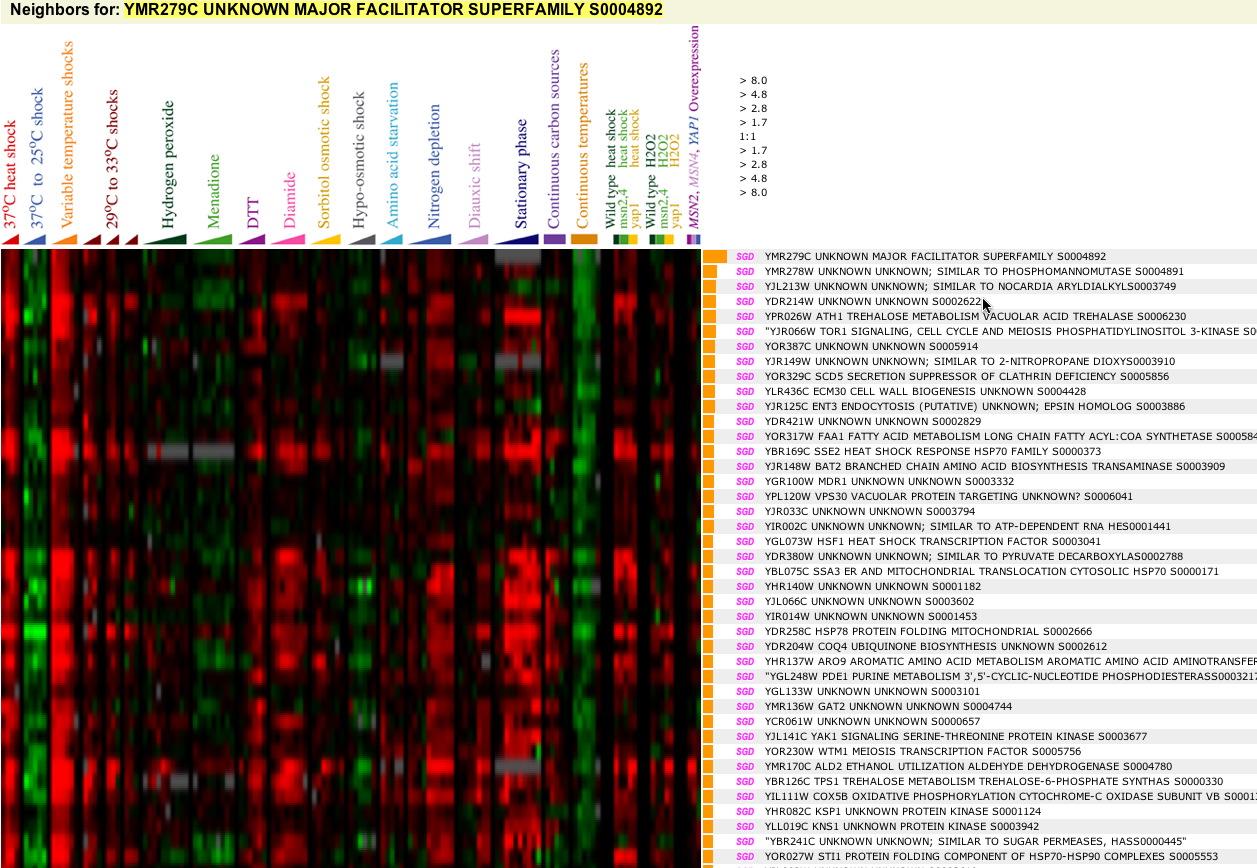
    First stop: the Saccharomyces Genome Database, host of the Expression Connection. fig. 2 presents an overview of CAT8's fold change amongst all of the microarray experiments in the database, revealing that it is usually only subtly induced or repressed. This is consistent with the notion that it is an early player in the pathway that ultimately causes the diauxic shift - it only needs to interact with a limited number of other proteins & binding sites. fig. 3 presents several of the less common experiments in which CAT8 experiences a 3+fold change in expression. We can use this perspective to help decide what datasets to evaulate first, and then begin exploring them. However, just because our gene underwent a large fold change doesn't guarantee the usefulness of the dataset - in some cases it isn't clear what aspect of the experimental conditions caused that change, and in other cases, especially those testing many different experimental conditions, no other genes have a similar pattern of expression, at least by the metrics used on the Expression Connection website. This is the case for several of the datasets listed below, including "Expression in response to environmental changes" by Gasch et al (2000). Exploring the data directly from the supplementary website is more informative (fig. 4). Notice the high amounts of induction in the "stationary phase" column. This is consistent with CAT8's role in regulating the diauxic shift.


Fig 3. MicroArray experiments hosted by SGD in which CAT8 expression levels changed at least 3-fold.
Courtesy of the Saccharomyces Genome Database (SGD) 2005.


Fig 4. The dynamic output of the web-based expression exploration program GeneExplorer, displaying genes with expression profiles similar to CAT8.
The program and dataset are hosted on the online supplement to Gausch et al. (2000).


    Although we didn't find it when looking for datasets in which CAT8 was highly up- or down-regulated, the dataset generated by DeRisi et al. (1997) specifically examines the diauxic shif, and 19 genes with expression patterns most similar to that of CAT8 are presented in fig. 5.

    It might be interesting to see how the expression of CAT8 compares to some of the other genes that it interacts with during the diauxic shift. Haurie et al. identified 32 genes that seem to be regulated by CAT8.3 19 of these genes are shown in Table 1, along with the top 19 most similar genes (based on expression profile similarity) identified by the Expression Connection website using the DeRisi dataset (fig. 5) and the 19 most similar identified by GeneExplorer using the larger Gasch dataset. Fig. 6 shows the differences in these three sets of genes based on their expression in during a diauxic shift.


Table 1. CAT8 and 19 hypothetically functionally-related genes. LEFT COLUMN: 19 genes identified by Haurie et al. as regulated by CAT8, ranked top to bottom in order of sensitivity to CAT8. MIDDLE & RIGHT: 19 genes with the most similar expression profiles to CAT8, ranked in descending order.
Literature-Haurie et al. Expression Connection- DeRisi et al. GeneExplorer- Gausch et al.
CAT8
FBP1
SFC1
SIP4
YCR010C
YPL156C
ICL1
PCK1
MLS1
YAR037Wc
IDP2
YAR040Cc
JEN1
ACS1
CRC1
ALD6
YERO24W
PUT4
CWP1
DLD1
CAT8
YDL057W
SHU2
EDE1
FMP45
SNO3
YOR055W
YDR018C
YBR284W
GCN2
CIS1
RPT3
HOP2
YDL242WW
MSH5
SOR1
PTR3
MDH3
YAL027W
SOR2
CAT8
PLC1
PXA1
YPR151C
YGL193C
IME4
YMR030W
QCR9
YDR504C
YDR273W
YLR345W
YMR114C
YPR061C
YP150W
VPS8
YCR010C
CIT3
COX14
ECM8
YPL185W


Fig 5. The expression profiles of 20 genes during the diauxic shift: CAT8 and the top 19 genes with the most similar expression pattern.
Courtesy of DeRisi et al.4 and the Saccharomyces Genome Database (SGD) 2005.


Fig 6. Graphical comparison between the three sets of similar genes. From the Expression Connection at the Saccharomyces Genome Database (SGD) 2005, based on data from DeRisi 1997.
Genes derived from Haurie et al.
Genes derived from Gausch et al.
Genes derived from DeRisi et al.


    The genes taken from Haurie et al. show the largest range of variation, with some upregulated in 12-fold or 14-fold amounts. This is interesting becuase the genes in this set are all supposed to be controlled by CAT8. CAT8 itself only experiences a 1.3 fold increase.

    The genes taken from Gausch et al. have a smaller range of expressed ratios, but much more variation within that range. The genes were selected not just on their similarity of expression during the diauxic shift, but also during a variety of other stresses, which helps to explain the increased variability in the plot of expression ratios compared to the other two sets of genes.

    The 19 genes selected to have the most similar expression pattern to CAT8 from the DeRisi et al. dataset tightly follow its expression ratio when plotted. But what do these genes do? If we didn't know the function of CAT8 and had inferred it from this group, it's not clear that we would have identified it as a transcriptional regulator, which is what it is currently thought to be. Even though this group of genes cluster the most tightly together, perhaps one of the other groups contains genes that are more similar to CAT8's function.


YMR279C

Fig 7. A histogram presenting the fold-change of YMR279C versus the number of experiments with that fold-change.
Courtesy of the Saccharomyces Genome Database (SGD) 2005.

    YMR279C is located directly next to CAT8 on yeast chromosome 13, but its function is unknown. What can we tell based on microarray experiments? Fig. 7 shows that YMR279C experiences about the same fold-change in all the experiments in the SGD as did CAT8 (fig. 1). Fig. 8 presents those experiements in which the fold change was equal to or greater than 3. Some of them are familiar from fig. 1, which asked the same question concerning CAT8. Fig. 9 presents a number of genes with similar expression patterns to YMR279C from the Gausch dataset, just as fig. 4 did for CAT8. What can we deduce from this clustering? The top three similar genes are also of unknown function, but the next two that are known are ATH1 and TOR1, the former involved in trehalose metabolism and the latter in cell signaling. This is interesting because the results of sequence analysis summarized on the previous web page indicated YMR279C was potentially a transport protein, bound in a phospholipid membrane, and that it had some conserved domains common to sugar transporters.


Fig 8. MicroArray experiments hosted by SGD in which YMR279C expression levels changed at least 3-fold.
Courtesy of the Saccharomyces Genome Database (SGD) 2005.


Fig 9. The dynamic output of the web-based expression exploration program GeneExplorer, displaying genes with expression profiles similar to YMR279C.
The program and dataset are hosted on the online supplement to Gausch et al. (2000).


Fig 10. A comparison of expression ratios between YMR279C and CAT8 (YMR280) during a diauxic shift. From the
Expression Connection at the Saccharomyces Genome Database (SGD) 2005, based on data from DeRisi 1997.


Conclusion

    CAT8 was difficult to characterize with expression data alone, probably because it is a transcription regulator - it rarely experiences big fold changes, and doesn't cluster well with other genes because it has a very specific purpose.

    YMR279C clustered with other transport genes, some for sugers like trehalose. This supports the prior sequence analysis, that YMR279C is a transport protein of some kind, probably for sugars.

References

1Wikipedia. 2005 21 Oct. Fermentation#History.<http://en.wikipedia.org/wiki/DNA_microarray>. Accessed 2005 21 Oct.

2SGD. the Saccharomyces Genome Database. <http://www.yeastgenome.org/>. Accessed 2005 20 Oct.

3Haurie V, Perrot M, Mini T, Jeno P, Sagliocco F, Boucherie H (2001) The transcriptional activator Cat8p provides a major contribution to the reprogramming of carbon metabolism during the diauxic shift in Saccharomyces cerevisiae. J Biol Chem 276(1):76-85. <SGD curated paper>. Accessed 2005 21 Oct.

4DeRisi JL, Iyer VR, Brown PO (1997) Exploring the metabolic and genetic control of gene expression on a genomic scale. Science 278(5338):680-6

5Gasch AP, Spellman PT, Kao CM, Carmel-Harel O, Eisen MB, Storz G, Botstein D, Brown PO (2000) Genomic expression programs in the response of yeast cells to environmental changes. Mol Biol Cell 11(12):4241-57. <SGD curated paper>. Accessed 2005 21 Oct.


Chu S, DeRisi J, Eisen M, Mulholland J, Botstein D, Brown PO, Herskowitz I (1998) The transcriptional program of sporulation in budding yeast. Science 282(5389):699-705 Saccharomyces Genome Database. 2005. <SGD curated paper>. Accessed 2005 20 Oct.

Hedges D, Proft M, Entian KD (1995) CAT8, a new zinc cluster-encoding gene necessary for derepression of gluconeogenic enzymes in the yeast Saccharomyces cerevisiae. Mol Cell Biol 15(4):1915-22. <SGD curated paper>. Accessed 2005 21 Oct.

Tachibana C, Yoo JY, Tagne JB, Kacherovsky N, Lee TI, Young ET (2005) Combined global localization analysis and transcriptome data identify genes that are directly coregulated by Adr1 and Cat8. Mol Cell Biol 25(6):2138-46. <SGD curated paper>. Accessed 2005 21 Oct.


HomeTrim5α MFYG:SequenceMFYG:Expression MFYG:ProteomicsCampbell's Genomics

© Copyright 2005 Department of Biology, Davidson College, Davidson, NC 28035
Send comments, questions, and suggestions to: macowell "at" davidson.edu