| Contents Open Reading Frame
Molecular Weight
Hydro-phobicity
Antigenicity
2ndary Structure
Multiple Alignment
Phylogenetic Tree |
. |
This web page was produced as an assignment for an undergraduate
course at Davidson College.
MacDNAsis is a powerful biological software program for the
analyzation and assessment of genetic information. An analysis was conducted on the enzyme
prostaglandin synthase to generate the following figures.
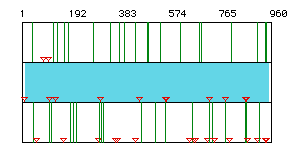
Figure 1. Open Reading Frame. The largest open reading frame of
prostaglandin synthase was found using American mink, Mustela
vison, cDNA. The largest open reading fram falls between the nucleotides 11-958,
as is indicated by the light blue box. Red
triangles indicates start codons, and green lines indicate
stop codons.
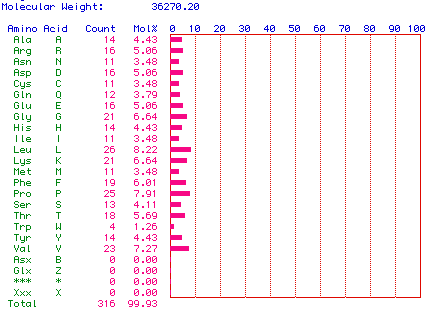
Figure 2. Molecular Weight. The molecular weight of
prostaglandin synthase was determined using American mink, Mustela
vison, cDNA. The number and frequency of the individual amino acids in the
protein is also graphed. The molecular weight of prostaglandin synthase is 36270.20
Daltons. Leucine is the most abundant, accounting for 8.22% of the protein.
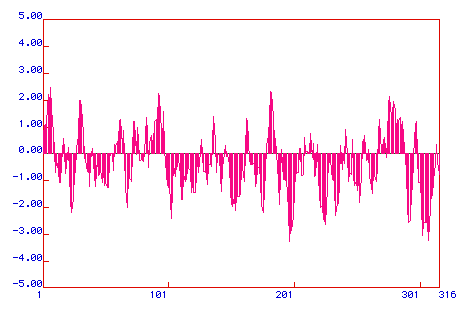
Figure 3. Hydrophobicity Plot. A Kyte & Doolittle
Hydrophobicity plot was graphed to determine if prostaglandin synthase is an integral
membrane protein. Areas with positive values are hydrophobic, and hydrophillic regions are
located below zero. If a region has a peak greater than positive 2, it is an integral
membrane protein. With four peaks above +2, prostaglandin synthase is an integral membrane
protein. However, a majority of the plot lies in the negative region indicating that the
protein is hydrophillic.
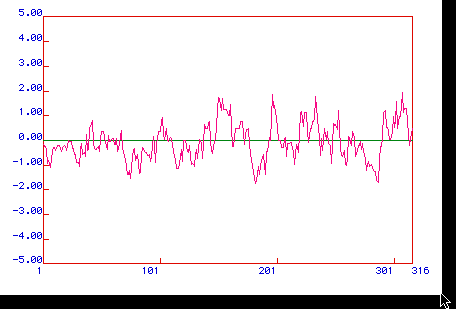
Figure 4. Antigenicity Plot. A Hopps & Wood Antigenicity
plot was graphed to determine prostaglandin synthase's hydrophillic regions. Positive
valued region indicates hydrophillicity, and may also be the most antigenic. There appear
to be two largely hydrophillic regions in prostaglandin synthase. One falls at
approximately amino acids 150-175, the other at approximately 290-316.
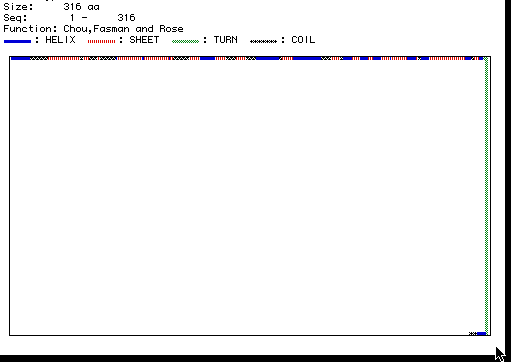
Figure 5. Secondary Structure. A Chou, Fasman, and Rose
secondary structure prediction was made to visualize the shape and structure of
prostaglandin synthase. Note that there is only one large turn,
followed by short helix and coil, however
the protein begins with a large series of helixes, coils, and sheets.
You may also view prostaglandin synthase as a 3-D Rasmol image.
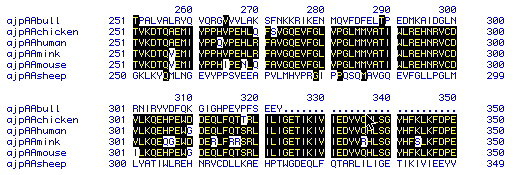
Figure 6. Multiple Alignments. This figure shows the amino acid
sequence similarity between prostaglandin synthase in six different species: bull,
chicken, human, mink, mouse, and sheep. Regions of multiple alignment are where several
species protein contains the same amino acid sequence. These regions are shaded in black.
Unshaded areas show where the species have a different amino acid sequence. The
results show a high degree of amino acid sequence similarity between four of the six
species: chicken, human, mink, and mouse. However, bulls and sheep appear to have
different sequences. To see the original amino acid sequences of each of the above choose:
Bull, Bos taurus; chicken, Gallus
gallus; human, Homo sapiens; American
mink, Mustela vison; mouse, Mus musculus; or sheep, Ovis
sp.
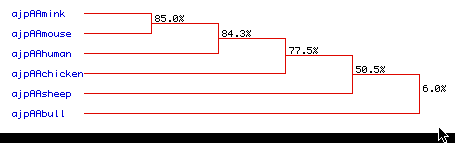
Figure 7. Phylogenetic Tree. A phylogenetic tree was used to
determine how closely species are related. This may indicate how the six species'
DNA has been conserved through evolution. It appears that mink and mice are closely
related, with a 85.0% similarity. There is also a high level of similarity between
mink, human, and mice, with a 84.3% rate of amino acid sequence
conservation. Chickens and sheep are also moderatly conserved at 77.5% and 50.5%,
respectively. However, there is a large divergence in similarity for the bull in amino
acid sequence at only 6.0%. Therfore,there is a high to extremely low range of
conservation in sequence of prostaglandin synthase. To see the original amino acid
sequences of each of the above choose: Bull, Bos taurus;
chicken, Gallus gallus; human, Homo sapiens; American mink, Mustela vison; mouse, Mus
musculus; or sheep, Ovis sp.
Author: Aaron J.
Patton
Return to Aaron's Molecular Biology Switchboard
Return to the International House of Aaron
Return to Davidson's
Molecular Biology Homepage
(c)2000 |
. |
. |